| |||||||||||||||||||||||||||||||||||||
33 of the 96 seats in the United States Senate 49 seats needed for a majority | |||||||||||||||||||||||||||||||||||||
---|---|---|---|---|---|---|---|---|---|---|---|---|---|---|---|---|---|---|---|---|---|---|---|---|---|---|---|---|---|---|---|---|---|---|---|---|---|
| |||||||||||||||||||||||||||||||||||||
Results of the elections: Democratic gain Democratic hold Republican hold No election Rectangular inset (Louisiana): both seats up for election | |||||||||||||||||||||||||||||||||||||
|
The 1948 United States Senate elections were held concurrently with the election of Democratic President Harry S. Truman for a full term. The 32 seats of Class 2 were contested in regular elections, and one special election was held to fill a vacancy. Truman campaigned against an "obstructionist" Congress that had blocked many of his initiatives, and additionally, the U.S. economy recovered from the postwar recession of 1946–1947 by election day. Thus, Truman was rewarded with a Democratic gain of nine seats in the Senate, enough to give them control of the chamber.[1][2] This was the last time until 2020 that Democrats flipped a chamber of Congress in a presidential election cycle.
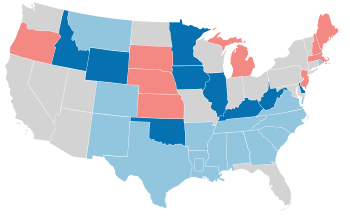
54 | 42 |
Democratic | Republican |
Colored shading indicates party with largest share of that row.
Parties | Total | ||||||||||||||||||||||||||||||||||||||||||||||||||||||||||||||||||||||||||||||||||||||||||||||||||
---|---|---|---|---|---|---|---|---|---|---|---|---|---|---|---|---|---|---|---|---|---|---|---|---|---|---|---|---|---|---|---|---|---|---|---|---|---|---|---|---|---|---|---|---|---|---|---|---|---|---|---|---|---|---|---|---|---|---|---|---|---|---|---|---|---|---|---|---|---|---|---|---|---|---|---|---|---|---|---|---|---|---|---|---|---|---|---|---|---|---|---|---|---|---|---|---|---|---|---|
Democratic | Republican | Other | |||||||||||||||||||||||||||||||||||||||||||||||||||||||||||||||||||||||||||||||||||||||||||||||||
Last elections (1946) Before these elections |
45 | 51 | 0 | 96 | |||||||||||||||||||||||||||||||||||||||||||||||||||||||||||||||||||||||||||||||||||||||||||||||
Not up | 30 | 33 | 0 | 63 | |||||||||||||||||||||||||||||||||||||||||||||||||||||||||||||||||||||||||||||||||||||||||||||||
Up | 15 | 18 | 0 | 33 | |||||||||||||||||||||||||||||||||||||||||||||||||||||||||||||||||||||||||||||||||||||||||||||||
Class 2 (1942→1948) | 14 | 18 | 0 | 32 | |||||||||||||||||||||||||||||||||||||||||||||||||||||||||||||||||||||||||||||||||||||||||||||||
Special: Class 3 | 1 | 0 | — | 1 | |||||||||||||||||||||||||||||||||||||||||||||||||||||||||||||||||||||||||||||||||||||||||||||||
Incumbent retired | 3 | 5 | — | 8 | |||||||||||||||||||||||||||||||||||||||||||||||||||||||||||||||||||||||||||||||||||||||||||||||
Held by same party | 3 | 4 | — | 7 | |||||||||||||||||||||||||||||||||||||||||||||||||||||||||||||||||||||||||||||||||||||||||||||||
Replaced by other party | 1 Republican replaced by 1 Democrat | — | 1 | ||||||||||||||||||||||||||||||||||||||||||||||||||||||||||||||||||||||||||||||||||||||||||||||||
Result | 4 | 4 | 0 | 8 | |||||||||||||||||||||||||||||||||||||||||||||||||||||||||||||||||||||||||||||||||||||||||||||||
Incumbent ran | 12 | 13 | — | 25 | |||||||||||||||||||||||||||||||||||||||||||||||||||||||||||||||||||||||||||||||||||||||||||||||
Won re-election | 10 | 5 | — | 17 | |||||||||||||||||||||||||||||||||||||||||||||||||||||||||||||||||||||||||||||||||||||||||||||||
Lost re-election | 8 Republicans replaced by 8 Democrats | — | 8 | ||||||||||||||||||||||||||||||||||||||||||||||||||||||||||||||||||||||||||||||||||||||||||||||||
Lost renomination but held by same party |
2 | 0 | — | 2 | |||||||||||||||||||||||||||||||||||||||||||||||||||||||||||||||||||||||||||||||||||||||||||||||
Result | 20 | 5 | 0 | 25 | |||||||||||||||||||||||||||||||||||||||||||||||||||||||||||||||||||||||||||||||||||||||||||||||
Total elected | 24 | 9 | 0 | 33 | |||||||||||||||||||||||||||||||||||||||||||||||||||||||||||||||||||||||||||||||||||||||||||||||
Net change | 9 | 9 | 9 | ||||||||||||||||||||||||||||||||||||||||||||||||||||||||||||||||||||||||||||||||||||||||||||||||
Nationwide vote | 13,056,944 | 9,764,384 | 269,669 | 23,090,997 | |||||||||||||||||||||||||||||||||||||||||||||||||||||||||||||||||||||||||||||||||||||||||||||||
Share | 56.55% | 42.29% | 1.17% | 100% | |||||||||||||||||||||||||||||||||||||||||||||||||||||||||||||||||||||||||||||||||||||||||||||||
Result | 54 | 42 | 0 | 96 |
Source: Clerk of the U.S. House of Representatives[3]
Five Republicans and three Democrats retired instead of seeking re-election.
Eight Republicans and two Democrats sought re-election but lost in the primary or general election.
D1 | D2 | D3 | D4 | D5 | D6 | D7 | D8 | ||
D18 | D17 | D16 | D15 | D14 | D13 | D12 | D11 | D10 | D9 |
D19 | D20 | D21 | D22 | D23 | D24 | D25 | D26 | D27 | D28 |
D38 Mont. Ran |
D37 Miss. Ran |
D36 La. (sp) Retired |
D35 La. (reg) Ran |
D34 Ga. Ran |
D33 Colo. Ran |
D32 Ark. Ran |
D31 Ala. Ran |
D30 | D29 |
D39 N.M. Retired |
D40 N.C. (sp) N.C. (reg) Ran |
D41 R.I. Ran |
D42 S.C. Ran |
D43 Tenn. Ran |
D44 Texas Retired |
D45 Va. Ran |
R51 Wyo. Ran |
R50 W.Va. Ran |
R49 S.D. Retired |
Majority → | |||||||||
R39 Ky. Ran |
R40 Maine Retired |
R41 Mass. Ran |
R42 Mich. Ran |
R43 Minn. Ran |
R44 Neb. Ran |
R45 N.H. Ran |
R46 N.J. Retired |
R47 Okla. Retired |
R48 Ore. Ran |
R38 Kan. Retired |
R37 Iowa Ran |
R36 Ill. Ran |
R35 Idaho Ran |
R34 Del. Ran |
R33 | R32 | R31 | R30 | R29 |
R19 | R20 | R21 | R22 | R23 | R24 | R25 | R26 | R27 | R28 |
R18 | R17 | R16 | R15 | R14 | R13 | R12 | R11 | R10 | R9 |
R1 | R2 | R3 | R4 | R5 | R6 | R7 | R8 |
D1 | D2 | D3 | D4 | D5 | D6 | D7 | D8 | ||
D18 | D17 | D16 | D15 | D14 | D13 | D12 | D11 | D10 | D9 |
D19 | D20 | D21 | D22 | D23 | D24 | D25 | D26 | D27 | D28 |
D38 Mont. Re-elected |
D37 Miss. Re-elected |
D36 La. (sp) Hold |
D35 La. (reg) Re-elected |
D34 Ga. Re-elected |
D33 Colo. Re-elected |
D32 Ark. Re-elected |
D31 Ala. Re-elected |
D30 | D29 |
D39 N.M. Hold |
D40 N.C. (sp) N.C. (reg) Hold |
D41 R.I. Re-elected |
D42 S.C. Re-elected |
D43 Tenn. Hold |
D44 Texas Hold |
D45 Va. Re-elected |
D46 Del. Gain |
D47 Idaho Gain |
D48 Ill. Gain |
Majority → | D49 Iowa Gain | ||||||||
R39 N.H. Re-elected |
R40 N.J. Hold |
R41 Ore. Re-elected |
R42 S.D. Hold |
D54 Wyo. Gain |
D53 W.Va. Gain |
D52 Okla. Gain |
D51 Minn. Gain |
D50 Ky. Gain | |
R38 Neb. Re-elected |
R37 Mich. Re-elected |
R36 Mass. Re-elected |
R35 Maine Hold |
R34 Kan. Hold |
R33 | R32 | R31 | R30 | R29 |
R19 | R20 | R21 | R22 | R23 | R24 | R25 | R26 | R27 | R28 |
R18 | R17 | R16 | R15 | R14 | R13 | R12 | R11 | R10 | R9 |
R1 | R2 | R3 | R4 | R5 | R6 | R7 | R8 |
Key: |
|
---|
In these special elections, the winner was seated during 1948 or before January 3, 1949; ordered by election date.
State | Incumbent | Results | Candidates | ||
---|---|---|---|---|---|
Senator | Party | Electoral history | |||
Louisiana (Class 3) |
William C. Feazel | Democratic | 1948 (Appointed) | Interim appointee retired. Winner elected November 2, 1948. Democratic hold. |
|
North Carolina (Class 2) |
William B. Umstead | Democratic | 1946 (Appointed) | Interim appointee lost nomination. Winner elected November 2, 1948. Democratic hold. Winner also elected to the next full term. |
|
In these general elections, the winners were elected for the term beginning January 3, 1949; ordered by state.
All of the elections involved the Class 2 seats.
State | Incumbent | Results | Candidates | ||
---|---|---|---|---|---|
Senator | Party | Electoral history | |||
Alabama | John Sparkman | Democratic | 1946 (special) | Incumbent re-elected. |
|
Arkansas | John L. McClellan | Democratic | 1942 | Incumbent re-elected. |
|
Colorado | Edwin C. Johnson | Democratic | 1936 1942 |
Incumbent re-elected. |
|
Delaware | C. Douglass Buck | Republican | 1942 | Incumbent lost re-election. New senator elected. Democratic gain. |
|
Georgia | Richard Russell Jr. | Democratic | 1932 (special) 1936 1942 |
Incumbent re-elected. |
|
Idaho | Henry Dworshak | Republican | 1946 (special) | Incumbent lost re-election. New senator elected. Democratic gain. |
|
Illinois | C. Wayland Brooks | Republican | 1940 (special) 1942 |
Incumbent lost re-election. New senator elected. Democratic gain. |
|
Iowa | George A. Wilson | Republican | 1942 | Incumbent lost re-election. New senator elected. Democratic gain. |
|
Kansas | Arthur Capper | Republican | 1918 1924 1930 1936 1942 |
Incumbent retired. New senator elected. Republican hold. |
|
Kentucky | John Sherman Cooper | Republican | 1946 (special) | Incumbent lost re-election. New senator elected. Democratic gain. |
|
Louisiana | Allen J. Ellender | Democratic | 1936 1942 |
Incumbent re-elected. |
|
Maine | Wallace H. White | Republican | 1930 1936 1942 |
Incumbent retired. New senator elected. Republican hold. |
|
Massachusetts | Leverett Saltonstall | Republican | 1944 (special) | Incumbent re-elected. |
|
Michigan | Homer S. Ferguson | Republican | 1942 | Incumbent re-elected. |
|
Minnesota | Joseph H. Ball | Republican | 1940 (Appointed) 1942 (Retired) 1942 |
Incumbent lost re-election. New senator elected. Democratic–Farmer–Labor gain. |
|
Mississippi | James Eastland | Democratic | 1941 (Appointed) 1941 (Retired) 1942 |
Incumbent re-elected. |
|
Montana | James E. Murray | Democratic | 1934 (special) 1936 1942 |
Incumbent re-elected. |
|
Nebraska | Kenneth S. Wherry | Republican | 1942 | Incumbent re-elected. |
|
New Hampshire | Styles Bridges | Republican | 1936 1942 |
Incumbent re-elected. |
|
New Jersey | Albert W. Hawkes | Republican | 1942 | Incumbent retired. New senator elected. Republican hold. |
|
New Mexico | Carl Hatch | Democratic | 1933 (Appointed) 1934 (special) 1936 1942 |
Incumbent retired. New senator elected. Democratic hold. |
|
North Carolina | William B. Umstead | Democratic | 1946 (Appointed) | Interim appointee lost nomination. New senator elected. Democratic hold. Winner also elected to finish the term, see above. |
|
Oklahoma | Edward H. Moore | Republican | 1942 | Incumbent retired. New senator elected. Democratic gain. |
|
Oregon | Guy Cordon | Republican | 1944 (Appointed) 1944 (special) |
Incumbent re-elected. |
|
Rhode Island | Theodore F. Green | Democratic | 1936 1942 |
Incumbent re-elected. |
|
South Carolina | Burnet R. Maybank | Democratic | 1941 (special) 1942 |
Incumbent re-elected. |
|
South Dakota | Vera C. Bushfield | Republican | 1948 (Appointed) | Interim appointee retired. New senator elected. Republican hold. Incumbent resigned December 26, 1948 and winner appointed December 31, 1948 to finish the term. |
|
Tennessee | Tom Stewart | Democratic | 1938 (special) | Incumbent lost re-nomination. New senator elected. Democratic hold. |
|
Texas | W. Lee O'Daniel | Democratic | 1941 (special) 1942 |
Incumbent retired. New senator elected. Democratic hold. |
|
Virginia | A. Willis Robertson | Democratic | 1946 (special) | Incumbent re-elected. |
|
West Virginia | Chapman Revercomb | Republican | 1942 | Incumbent lost re-election. New senator elected. Democratic gain. |
|
Wyoming | Edward V. Robertson | Republican | 1942 | Incumbent lost re-election. New senator elected. Democratic gain. |
|
Six races had a margin of victory under 10%:
State | Party of winner | Margin |
---|---|---|
Idaho | Democratic (flip) | 1.5% |
Michigan | Republican | 2.2% |
Delaware | Democratic (flip) | 2.6% |
New Jersey | Republican | 2.7% |
Kentucky | Democratic (flip) | 3.1% |
Massachusetts | Republican | 6.6% |
Wyoming is the tipping point state with a margin of 14.2%.
| |||||||||||||||||
| |||||||||||||||||
County results Sparkman: 50–60% 60–70% 70–80% 80–90% 90–100% Parsons: 50-60% | |||||||||||||||||
|
Main article: 1948 United States Senate election in Alabama |
See also: List of United States senators from Alabama and 1948 United States House of Representatives elections in Alabama |
Party | Candidate | Votes | % | |
---|---|---|---|---|
Democratic | John Sparkman (Incumbent) | 185,534 | 84.00% | |
Republican | Paul G. Parsons | 35,341 | 16.00% | |
Majority | 150,193 | 68.00% | ||
Turnout | 220,875 | |||
Democratic hold |
See also: List of United States senators from Arkansas and 1948 United States House of Representatives elections in Arkansas |
Party | Candidate | Votes | % | |
---|---|---|---|---|
Democratic | John L. McClellan (Incumbent) | 216,401 | 100.00% | |
Democratic hold |
| |||||||||||||||||
| |||||||||||||||||
County results Johnson: 50–60% 60–70% 70–80% | |||||||||||||||||
|
Main article: 1948 United States Senate election in Colorado |
See also: List of United States senators from Colorado and 1948 United States House of Representatives elections in Colorado |
Party | Candidate | Votes | % | |
---|---|---|---|---|
Democratic | Edwin C. Johnson (Incumbent) | 340,719 | 66.79% | |
Republican | Will Nicholson | 165,069 | 32.36% | |
Progressive | Joe Gurule | 2,981 | 0.58% | |
Socialist | Carle Whithead | 1,352 | 0.27% | |
Majority | 175,650 | 34.43% | ||
Turnout | 510,121 | |||
Democratic hold |
| |||||||||||||||||
County Results Frear: 50–60% Buck: 50–60% | |||||||||||||||||
|
Main article: 1948 United States Senate election in Delaware |
See also: List of United States senators from Delaware and 1948 United States House of Representatives election in Delaware |
Party | Candidate | Votes | % | |
---|---|---|---|---|
Democratic | J. Allen Frear Jr. | 71,888 | 50.85% | |
Republican | C. Douglass Buck (incumbent) | 68,246 | 48.28% | |
Majority | 3,642 | 2.57% | ||
Turnout | 141,362 | |||
Democratic gain from Republican |
Main article: 1948 United States Senate election in Georgia |
See also: List of United States senators from Georgia and 1948 United States House of Representatives elections in Georgia |
| ||||||||||||||||||||
| ||||||||||||||||||||
County results Russell: >90% | ||||||||||||||||||||
|
Party | Candidate | Votes | % | |
---|---|---|---|---|
Democratic | Richard Russell Jr. (Incumbent) | 362,104 | 99.89% | |
Write-In | Larkin Marshall | 388 | 0.11% | |
Write-In | Ellis Arnall | 9 | 0.00% | |
Write-In | Roy Harris | 2 | 0.00% | |
Write-In | Harry Sommers | 1 | 0.00% | |
Majority | 361,716 | 99.78% | ||
Turnout | 362,504 | |||
Democratic hold |
See also: List of United States senators from Idaho and 1948 United States House of Representatives elections in Idaho |
Democrat Bert H. Miller defeated incumbent Republican Henry Dworshak. As of 2024, this remains the only time that a Democrat would win Idaho's Class 2 Senate seat. Dworshak was appointed back to this seat in October 1949 after Miller died earlier that month and served until he himself died in 1962.
Party | Candidate | Votes | % | |
---|---|---|---|---|
Democratic | Bert H. Miller | 107,000 | 49.96% | |
Republican | Henry Dworshak (Incumbent) | 103,868 | 48.49% | |
Progressive | John Derr | 3,154 | 1.47% | |
Socialist | Paul Wengert | 166 | 0.08% | |
Majority | 3,132 | 1.47% | ||
Turnout | 214,188 | |||
Democratic gain from Republican |
| |||||||||||||||||
| |||||||||||||||||
County results Douglas: 40–50% 50–60% 60–70% Tie: 40–50% Brooks: 40–50% 50–60% 60–70% 70–80% | |||||||||||||||||
|
Main article: 1948 United States Senate election in Illinois |
See also: List of United States senators from Illinois and 1948 United States House of Representatives elections in Illinois |
Party | Candidate | Votes | % | |
---|---|---|---|---|
Democratic | Paul Douglas | 2,147,754 | 55.07% | |
Republican | Charles W. Brooks (Incumbent) | 1,740,026 | 44.61% | |
Prohibition | Enoch A. Holtwick | 9,784 | 0.25% | |
Socialist Labor | Frank Schnur | 2,693 | 0.07% | |
None | Write-In | 28 | 0.00% | |
Majority | 407,728 | 10.46% | ||
Turnout | 3,900,285 | |||
Democratic gain from Republican |
| |||||||||||||||||
| |||||||||||||||||
County results Gillette: 40–50% 50–60% 60–70% Wilson: 50–60% | |||||||||||||||||
|
Main article: 1948 United States Senate election in Iowa |
See also: List of United States senators from Iowa and 1948 United States House of Representatives elections in Iowa |
Party | Candidate | Votes | % | |
---|---|---|---|---|
Democratic | Guy Gillette | 578,226 | 57.80% | |
Republican | George A. Wilson (Incumbent) | 415,778 | 41.56% | |
Progressive | Seymour Pitcher | 3,387 | 0.34% | |
Prohibition | Z. Everett Kellum | 2,580 | 0.26% | |
Socialist | Hugo Bockewitz | 441 | 0.04% | |
Majority | 162,448 | 16.24% | ||
Turnout | 1,000,412 | |||
Democratic gain from Republican |
See also: List of United States senators from Kansas and 1948 United States House of Representatives elections in Kansas |
Party | Candidate | Votes | % | |
---|---|---|---|---|
Republican | Andrew Frank Schoeppel | 393,412 | 54.92% | |
Democratic | George McGill | 305,987 | 42.72% | |
Prohibition | C. Floyd Hester | 16,943 | 2.37% | |
Majority | 87,425 | 12.20% | ||
Turnout | 716,342 | |||
Republican hold |
| |||||||||||||||||
| |||||||||||||||||
County results Chapman: 50–60% 60–70% 70–80% 80–90% Cooper: 40–50% 50–60% 60–70% 70–80% 80–90% | |||||||||||||||||
|
Main article: 1948 United States Senate election in Kentucky |
See also: List of United States senators from Kentucky and 1948 United States House of Representatives elections in Kentucky |
Party | Candidate | Votes | % | |
---|---|---|---|---|
Democratic | Virgil Chapman | 408,256 | 51.39% | |
Republican | John Sherman Cooper (Incumbent) | 383,776 | 48.31% | |
Socialist | W. A. Standefur | 1,232 | 0.16% | |
Progressive | H. G. Stanfield | 924 | 0.12% | |
Socialist Labor | David R. Cox | 254 | 0.03% | |
Write-In | John Y. Brown | 26 | 0.00% | |
Write-In | O. G. Gaines | 1 | 0.00% | |
Majority | 24,480 | 3.08% | ||
Turnout | 794,469 | |||
Democratic gain from Republican |
See also: List of United States senators from Louisiana and 1948 United States House of Representatives elections in Louisiana |
Main article: 1948 United States Senate election in Louisiana |
Party | Candidate | Votes | % | |
---|---|---|---|---|
Democratic | Allen J. Ellender (Incumbent) | 330,115 | 100.00% | |
Independent | Maurice Eugene Clark | 9 | 0.00% | |
Majority | 330,106 | 100.00% | ||
Turnout | 330,124 | |||
Democratic hold |
Party | Candidate | Votes | % | |
---|---|---|---|---|
Democratic | Russell B. Long | 306,336 | 74.96% | |
Republican | Clem S. Clarke | 102,331 | 25.04% | |
Majority | 204,005 | 49.92% | ||
Turnout | 408,667 | |||
Democratic hold |
| |||||||||||||||||
| |||||||||||||||||
|
Main article: 1948 United States Senate election in Maine |
See also: List of United States senators from Maine and 1948 United States House of Representatives elections in Maine |
Party | Candidate | Votes | % | |
---|---|---|---|---|
Republican | Margaret Chase Smith | 159,182 | 71.30% | |
Democratic | Adrian H. Scolten | 64,074 | 28.70% | |
Majority | 95,108 | 42.60% | ||
Turnout | 223,256 | |||
Republican hold |
| |||||||||||||||||
| |||||||||||||||||
Saltonstall: 50–60% 60–70% 70–80% 80–90% 90–100% Fitzgerald: 50–60% 60–70% 70–80% | |||||||||||||||||
|
Main article: 1948 United States Senate election in Massachusetts |
See also: List of United States senators from Massachusetts and 1948 United States House of Representatives elections in Massachusetts |
Party | Candidate | Votes | % | |
---|---|---|---|---|
Republican | Leverett Saltonstall (Incumbent) | 1,088,475 | 52.95% | |
Democratic | John I. Fitzgerald | 954,398 | 46.42% | |
Socialist Labor | Henning A. Blomen | 9,266 | 0.45% | |
Prohibition | E. Tallmadge Root | 3,652 | 0.18% | |
None | Scattering | 7 | 0.00% | |
Majority | 134,077 | 6.53% | ||
Turnout | 2,055,798 | |||
Republican hold |
| |||||||||||||||||
| |||||||||||||||||
County results Ferguson: 40–50% 50–60% 60–70% 70–80% 80–90% Hook: 50–60% 60–70% | |||||||||||||||||
|
Main article: 1948 United States Senate election in Michigan |
See also: List of United States senators from Michigan and 1948 United States House of Representatives elections in Michigan |
Party | Candidate | Votes | % | |
---|---|---|---|---|
Republican | Homer S. Ferguson (Incumbent) | 1,045,156 | 50.68% | |
Democratic | Frank E. Hook | 1,000,329 | 48.51% | |
Prohibition | Harold A. Lindahl | 12,146 | 0.59% | |
Socialist | Michael Magee | 2,160 | 0.10% | |
Socialist Labor | Theos S. Grove | 1,418 | 0.07% | |
Socialist Workers | Genora Dollinger | 882 | 0.04% | |
None | Scattering | 2.57% | 0.00% | |
Majority | 44,827 | 2.17% | ||
Turnout | 2,062,093 | |||
Republican hold |
| |||||||||||||||||
County results Humphrey: 50–60% 60–70% 70–80% Ball: 50-60% 60-70% | |||||||||||||||||
|
Main article: 1948 United States Senate election in Minnesota |
See also: List of United States senators from Minnesota and 1948 United States House of Representatives elections in Minnesota |
Party | Candidate | Votes | % | |
---|---|---|---|---|
Democratic (DFL) | Hubert Humphrey | 729,494 | 59.78% | |
Republican | Joseph H. Ball (Incumbent) | 485,801 | 39.81% | |
Socialist Workers | Vincent R. Dunne | 4,951 | 0.41% | |
None | Scattering | 41.56% | 0.00% | |
Majority | 243,693 | 19.97% | ||
Turnout | 1,220,250 | |||
Democratic (DFL) gain from Republican |
See also: List of United States senators from Mississippi and 1948 United States House of Representatives elections in Mississippi |
Party | Candidate | Votes | % | |
---|---|---|---|---|
Democratic | James Eastland (Incumbent) | 151,478 | 100.00% | |
Democratic hold |
| |||||||||||||||||
| |||||||||||||||||
County results Murray: 50–60% 60–70% Davis: 50–60% 60–70% | |||||||||||||||||
|
Main article: 1948 United States Senate election in Montana |
See also: List of United States senators from Montana and 1948 United States House of Representatives elections in Montana |
Incumbent United States Senator James E. Murray, who was first elected to the Senate in a special election in 1934 and was re-elected in 1936 and 1942, ran for re-election. After winning the Democratic primary, he faced Tom J. Davis, an attorney and the Republican nominee, in the general election. Following a narrow re-election in 1936, Murray significantly expanded his margin of victory and comfortably won re-election over Davis, winning his fourth term and his third full term in the Senate.
Party | Candidate | Votes | % | |
---|---|---|---|---|
Democratic | James E. Murray (Incumbent) | 125,193 | 56.65% | |
Republican | Tom J. Davis | 94,458 | 42.74% | |
Prohibition | C. S. Hanna | 1,352 | 0.61% | |
Majority | 30,735 | 13.91% | ||
Turnout | 221,003 | |||
Democratic hold |
| |||||||||||||||||
| |||||||||||||||||
County results Wherry: 50–60% 60–70% 70–80% Carpenter: 50–60% 60–70% | |||||||||||||||||
|
Main article: 1948 United States Senate election in Nebraska |
See also: List of United States senators from Nebraska and 1948 United States House of Representatives elections in Nebraska |
Party | Candidate | Votes | % | |
---|---|---|---|---|
Republican | Kenneth S. Wherry (Incumbent) | 267,575 | 56.67% | |
Democratic | Terry Carpenter | 204,320 | 43.27% | |
N/A | Scattering | 261 | 0.06% | |
Majority | 63,255 | 13.40% | ||
Turnout | 472,156 | |||
Republican hold |
| |||||||||||||||||
| |||||||||||||||||
County results Bridges: 50–60% 60–70% 80–90% Fortin: 50–60% | |||||||||||||||||
|
Main article: 1948 United States Senate election in New Hampshire |
See also: List of United States senators from New Hampshire and 1948 United States House of Representatives elections in New Hampshire |
Party | Candidate | Votes | % | |
---|---|---|---|---|
Republican | Styles Bridges (Incumbent) | 129,600 | 58.14% | |
Democratic | Alfred E. Fortin | 91,760 | 41.17% | |
Progressive | John G. Rideout | 1,538 | 0.69% | |
Majority | 37,840 | 16.97% | ||
Turnout | 222,898 | |||
Republican hold |
| |||||||||||||||||
County Results Hendrickson: 40–50% 50-60% 60-70% 70-80% Alexander: 40–50% 50–60% 60–70% | |||||||||||||||||
|
Main article: 1948 United States Senate election in New Jersey |
See also: List of United States senators from New Jersey and 1948 United States House of Representatives elections in New Jersey |
Party | Candidate | Votes | % | |
---|---|---|---|---|
Republican | Robert C. Hendrickson | 934,720 | 49.99% | |
Democratic | Archibald S. Alexander | 884,414 | 47.30% | |
Progressive | James Imbrie | 22,658 | 1.21% | |
Socialist | Rubye Smith | 11,450 | 0.61% | |
Socialist Workers | George Breitman | 8,076 | 0.43% | |
Prohibition | George W. Rideout | 4,656 | 0.25% | |
Socialist Labor | George E. Bopp | 3,908 | 0.21% | |
Majority | 50,306 | 2.69% | ||
Turnout | 1,869,882 | |||
Republican hold |
See also: List of United States senators from New Mexico and 1948 United States House of Representatives election in New Mexico |
Party | Candidate | Votes | % | |
---|---|---|---|---|
Democratic | Clinton Anderson (Incumbent) | 108,269 | 57.44% | |
Republican | Patrick J. Hurley | 80,226 | 42.56% | |
Majority | 28,043 | 13.88% | ||
Turnout | 188,495 | |||
Democratic hold |
See also: List of United States senators from North Carolina and 1948 United States House of Representatives elections in North Carolina |
There were 2 elections to the same seat, due to the December 15, 1946 death of three-term Democrat Josiah Bailey. Democratic former congressman William B. Umstead was appointed December 18, 1946 to continue Bailey's term, pending a special election.
Umstead supported the conservative Taft–Hartley Act. The Democratic former Governor of North Carolina J. Melville Broughton was seen as a "rather liberal alternative" to Umstead. Broughton beat Umstead in the Democratic primaries and then won the general elections.
Party | Candidate | Votes | % | |
---|---|---|---|---|
Democratic | J. Melville Broughton | 206,605 | 52.30% | |
Democratic | William B. Umstead (Incumbent) | 188,420 | 47.70% | |
Majority | 18,196 | 4.60% |
Party | Candidate | Votes | % | |
---|---|---|---|---|
Democratic | J. Melville Broughton | 534,917 | 100.00% | |
Democratic hold |
Party | Candidate | Votes | % | |
---|---|---|---|---|
Democratic | J. Melville Broughton | 207,981 | 53.10% | |
Democratic | William B. Umstead (Incumbent) | 183,865 | 46.90% | |
Majority | 23,894 | 6.10% |
Party | Candidate | Votes | % | |
---|---|---|---|---|
Democratic | J. Melville Broughton | 540,762 | 70.70% | |
Republican | John A. Wilkinson | 220,307 | 28.80% | |
Majority | 320,455 | 41.91% | ||
Democratic hold |
Broughton was seated December 31, 1948 to finish the current term but died March 6, 1949, just after the new term began. His death lead to another appointment (Democrat Frank Graham) in 1949 and another special election in 1950 of Democrat Willis Smith. Smith also died during the term, leading to yet another appointment (Democrat Alton A. Lennon) and 1954 special election (of Democrat W. Kerr Scott). In all, five senators held the seat during the 1949–1955 term.
Main article: 1948 United States Senate election in Oklahoma |
See also: List of United States senators from Oklahoma and 1948 United States House of Representatives elections in Oklahoma |
Party | Candidate | Votes | % | |
---|---|---|---|---|
Democratic | Robert S. Kerr | 441,654 | 62.30% | |
Republican | Ross Rizley | 265,169 | 37.40% | |
Independent | W. O. Pratt | 2,108 | 0.30% | |
Majority | 176,485 | 24.90% | ||
Turnout | 708,931 | |||
Democratic gain from Republican |
See also: List of United States senators from Oregon and 1948 United States House of Representatives elections in Oregon |
Party | Candidate | Votes | % | |
---|---|---|---|---|
Republican | Guy Cordon (Incumbent) | 299,295 | 60.03% | |
Democratic | Manley J. Wilson | 199,275 | 39.97% | |
Majority | 100,020 | 20.06% | ||
Turnout | 498,570 | |||
Republican hold |
See also: List of United States senators from Rhode Island and 1948 United States House of Representatives elections in Rhode Island |
Party | Candidate | Votes | % | |
---|---|---|---|---|
Democratic | Theodore F. Green (Incumbent) | 190,158 | 59.35% | |
Republican | Thomas P. Hazard | 130,262 | 40.65% | |
Majority | 59,896 | 18.70% | ||
Turnout | 320,420 | |||
Democratic hold |
Main article: 1948 United States Senate election in South Carolina |
See also: List of United States senators from South Carolina and 1948 United States House of Representatives elections in South Carolina |
Senator Burnet R. Maybank was opposed in the Democratic primary by U.S. Representative William Jennings Bryan Dorn and three other candidates. Maybank obtained over 50% in the primary election on August 10 to avoid a runoff election.
Democratic Primary | ||
---|---|---|
Candidate | Votes | % |
Burnet R. Maybank | 161,608 | 51.5 |
W.J. Bryan Dorn | 76,749 | 24.4 |
Neville Bennett | 43,068 | 13.7 |
Alan Johnstone | 17,689 | 5.6 |
Marcus A. Stone | 14,904 | 4.8 |
Since the end of Reconstruction in 1877, the Democratic Party dominated the politics of South Carolina and its statewide candidates were never seriously challenged. Maybank did not campaign for the general election as there was no chance of defeat.
Party | Candidate | Votes | % | |
---|---|---|---|---|
Democratic | Burnet R. Maybank (Incumbent) | 135,998 | 96.45% | |
Republican | J. Bates Gerald | 5,008 | 3.55% | |
Majority | 130,990 | 92.90 | ||
Turnout | 141,006 | |||
Democratic hold |
| |||||||||||||||||
| |||||||||||||||||
County results Mundt: 50–60% 60–70% 70–80% 80–90% Engel: 50–60% 60–70% | |||||||||||||||||
|
Main article: 1948 United States Senate election in South Dakota |
See also: List of United States senators from South Dakota and 1948 United States House of Representatives elections in South Dakota |
Party | Candidate | Votes | % | |
---|---|---|---|---|
Republican | Karl E. Mundt | 144,084 | 59.33% | |
Democratic | John A. Engel | 98,749 | 40.67% | |
Majority | 45,335 | 18.66% | ||
Turnout | 242,833 | |||
Republican hold |
| |||||||||||||||||
| |||||||||||||||||
|
Main article: 1948 United States Senate election in Tennessee |
See also: List of United States senators from Tennessee and 1948 United States House of Representatives elections in Tennessee |
Party | Candidate | Votes | % | |
---|---|---|---|---|
Democratic | Estes Kefauver | 326,142 | 65.33% | |
Republican | B. Carroll Reece | 166,947 | 33.44% | |
Independent | John Randolph Neal Jr. | 6,103 | 1.22% | |
None | Scattering | 26 | 0.01% | |
Majority | 159,195 | 31.89% | ||
Turnout | 499,218 | |||
Democratic hold |
| |||||||||||||||||
County Results[6] Johnson: 50–60% 60–70% 70–80% 80–90% >90% | |||||||||||||||||
|
Main article: 1948 United States Senate election in Texas |
See also: List of United States senators from Texas and 1948 United States House of Representatives elections in Texas |
Incumbent Democrat W. Lee O'Daniel decided to retire rather than seek a second full term. Congressman Lyndon Johnson won the highly contested Democratic primary against former governor Coke Stevenson. Johnson went on to win the general election against Republican Jack Porter, but by a closer margin than usual for Texas Democrats.
Party | Candidate | Votes | % | |
---|---|---|---|---|
Democratic | Lyndon Johnson | 702,985 | 66.22% | |
Republican | Jack Porter | 349,665 | 32.94% | |
Prohibition | Samuel N. Morris | 8,913 | 0.84% | |
Majority | 353,320 | 33.28% | ||
Turnout | 1,061,563 | |||
Democratic hold |
| |||||||||||||||||
| |||||||||||||||||
|
Main article: 1948 United States Senate election in Virginia |
See also: List of United States senators from Virginia and 1948 United States House of Representatives elections in Virginia |
Incumbent Democrat A. Willis Robertson defeated Republican Robert H. Woods and was re-elected to his first full term in office.
Party | Candidate | Votes | % | ±% | |
---|---|---|---|---|---|
Democratic | A. Willis Robertson (Incumbent) | 253,865 | 65.74% | -2.41% | |
Republican | Robert H. Woods | 118,546 | 30.70% | +1.68% | |
Independent | Howard Carwile | 6,788 | 1.76% | ||
Progressive | Virginia Foster Durr | 5,347 | 1.38% | +1.38% | |
Socialist | Clarke T. Robb | 1,627 | 0.42% | -2.40% | |
Write-ins | 5 | <0.01% | |||
Majority | 135,319 | 35.04% | -4.09% | ||
Turnout | 386,168 | ||||
Democratic hold | Swing |
See also: List of United States senators from West Virginia and 1948 United States House of Representatives elections in West Virginia |
Party | Candidate | Votes | % | |
---|---|---|---|---|
Democratic | Matthew M. Neely | 435,354 | 56.99% | |
Republican | Chapman Revercomb (Incumbent) | 328,534 | 43.01% | |
Majority | 106,810 | 13.98% | ||
Turnout | 763,888 | |||
Democratic gain from Republican |
Main article: 1948 United States Senate election in Wyoming |
See also: List of United States senators from Wyoming and 1948 United States House of Representatives election in Wyoming |
| |||||||||||||||||
| |||||||||||||||||
|
Party | Candidate | Votes | % | |
---|---|---|---|---|
Democratic | Lester C. Hunt | 57,953 | 57.11% | |
Republican | Edward V. Robertson (Incumbent) | 43,527 | 42.89% | |
Majority | 14,426 | 14.22% | ||
Turnout | 101,480 | |||
Democratic gain from Republican |
|}