
Wind power in Idaho could generate more energy than the state uses.
Wind power in Idaho could generate more energy than the state uses.
At the end of 2016, Idaho had 973 MW of wind power generating capacity installed, accounting for over 15% of its generated electricity.[1]
| Idaho Wind Generation by Year | Idaho Wind Generation Capacity by Year |
|---|---|
 |
 |
| Thousands of megawatt-hours Generated[2][3] | Megawatts of Wind Capacity[4] |

Idaho could potentially install 18,000 MW of wind power, capable of generating 52,000 million kWh/year according to a study by the National Renewable Energy Laboratory.[5] Idaho used 23,063 million kWh in 2016[6]
|
Main article: List of power stations in Idaho § Wind |
The 125 MW Goshen Wind Farm has been the state's largest wind facility since year 2010.[7]
| Idaho Wind Generation (GWh, Million kWh) | |||||||||||||
|---|---|---|---|---|---|---|---|---|---|---|---|---|---|
| Year | Total | Jan | Feb | Mar | Apr | May | Jun | Jul | Aug | Sep | Oct | Nov | Dec |
| 2006 | 169 | 14 | 10 | 18 | 16 | 16 | 14 | 10 | 12 | 9 | 15 | 21 | 14 |
| 2007 | 171 | 10 | 16 | 17 | 13 | 16 | 15 | 9 | 17 | 14 | 13 | 17 | 14 |
| 2008 | 209 | 20 | 19 | 19 | 18 | 17 | 16 | 11 | 12 | 12 | 18 | 22 | 25 |
| 2009 | 315 | 30 | 23 | 32 | 29 | 23 | 18 | 16 | 18 | 21 | 33 | 34 | 38 |
| 2010 | 442 | 26 | 20 | 28 | 33 | 34 | 26 | 22 | 23 | 26 | 57 | 69 | 78 |
| 2011 | 1,306 | 52 | 101 | 158 | 134 | 113 | 123 | 106 | 81 | 65 | 122 | 143 | 108 |
| 2012 | 1,891 | 169 | 110 | 200 | 132 | 134 | 127 | 104 | 116 | 93 | 160 | 180 | 366 |
| 2013 | 2,459 | 154 | 216 | 239 | 294 | 207 | 183 | 174 | 185 | 227 | 172 | 243 | 165 |
| 2014 | 2,806 | 206 | 326 | 301 | 294 | 205 | 240 | 186 | 131 | 192 | 238 | 265 | 222 |
| 2015 | 2,272 | 122 | 207 | 235 | 223 | 152 | 141 | 148 | 168 | 191 | 182 | 225 | 278 |
| 2016 | 2,577 | 224 | 251 | 293 | 248 | 193 | 202 | 216 | 151 | 99 | 167 | 234 | 299 |
| 2017 | 2,546 | 236 | 231 | 243 | 241 | 231 | 174 | 144 | 156 | 162 | 245 | 234 | 249 |
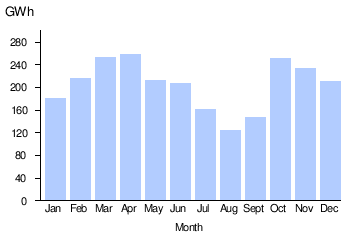
| 2018 | 2,655 | 234 | 217 | 274 | 277 | 206 | 228 | 182 | 188 | 192 | 202 | 222 | 233 |
| 2019 | 2,550 | 219 | 217 | 215 | 231 | 213 | 192 | 197 | 178 | 226 | 219 | 222 | 221 |
| 2020 | 2,770 | 269 | 323 | 232 | 226 | 243 | 233 | 190 | 187 | 150 | 234 | 254 | 229 |
| 2021 | 2,656 | 224 | 232 | 286 | 258 | 228 | 180 | 142 | 165 | 194 | 216 | 257 | 274 |
| 2022 | 2,887 | 278 | 283 | 297 | 300 | 250 | 191 | 156 | 149 | 183 | 234 | 295 | 271 |
| 2023 | 819 | 237 | 290 | 292 | |||||||||
Teal background indicates the largest wind generation month for the year.
Green background indicates the largest wind generation month to date.
Source:[2]
 |