← 2002 2003 2004 2005 2006 → Presidential election year | |
Election day | November 2 |
---|---|
Incumbent president | George W. Bush (Republican) |
Next Congress | 109th |
Presidential election | |
Partisan control | Republican hold |
Popular vote margin | Republican +2.4% |
Electoral vote | |
George W. Bush (R) | 286 |
John Kerry (D) | 251 |
2004 Presidential election results map. Red denotes states/districts won by Republican George W. Bush, and Blue denotes those won by Democrat John Kerry. Numbers indicate electoral votes allotted to the winner of each state. | |
Senate elections | |
Overall control | Republican hold |
Seats contested | 34 of 100 seats |
Net seat change | Republican +4 |
2004 Senate election results map | |
House elections | |
Overall control | Republican hold |
Popular vote margin | Republican +2.6% |
Net seat change | Republican +3 |
2004 House election results map | |
Gubernatorial elections | |
Seats contested | 13 (11 states, 2 territories) |
Net seat change | None |
2004 Gubernatorial election results map | |
Legend | |
Democratic gain Republican gain Democratic hold Republican hold Popular Democratic hold Nonpartisan |
The 2004 United States elections were held on November 2. Republican President George W. Bush won re-election and Republicans retained control of Congress.
Democratic Senator John Kerry of Massachusetts won his party's nomination after defeating Senator John Edwards and several other candidates in the 2004 Democratic presidential primaries. In the general election, Bush won 286 of the 538 electoral votes and 50.7 percent of the popular vote. Foreign policy was the dominant theme throughout the election campaign, particularly Bush's conduct of the War on Terrorism and the 2003 invasion of Iraq.
Riding Bush's coattails, the Republicans picked up net gains of four Senate seats and three House seats. In the gubernatorial elections, neither party won a net gain of seats. Bush became the first President since Ronald Reagan in 1980 to see his party gain seats in both Houses of Congress during a Presidential election year. Republicans would not win another trifecta until 2016.
As of 2020, this is the last time the incumbent party retained control over the presidency and Congress after a single term. It is the only election cycle since 1928 in which a Republican trifecta was successfully maintained, as well as the first time since the 1950 and 1952 elections that the Republicans gained seats in consecutive elections.
Main article: 2004 United States presidential election |
Republican incumbent President George W. Bush was re-elected, defeating Democratic Senator John Kerry from Massachusetts.
Main article: 2004 United States Senate elections |
The 34 seats in the United States Senate Class 3 were up for election. Republicans had a net gain of 4 seats. Summary of the United States Senate elections, 2004 results
Parties | Total | |||||||||||||||||||||||||||||||||||||||||||||||||||||||||||||||||||||||||||||||||||||||||||||||||
---|---|---|---|---|---|---|---|---|---|---|---|---|---|---|---|---|---|---|---|---|---|---|---|---|---|---|---|---|---|---|---|---|---|---|---|---|---|---|---|---|---|---|---|---|---|---|---|---|---|---|---|---|---|---|---|---|---|---|---|---|---|---|---|---|---|---|---|---|---|---|---|---|---|---|---|---|---|---|---|---|---|---|---|---|---|---|---|---|---|---|---|---|---|---|---|---|---|---|
Democratic | Republican | Independent | Libertarian | Others | ||||||||||||||||||||||||||||||||||||||||||||||||||||||||||||||||||||||||||||||||||||||||||||||
Before these elections | 48 | 51 | 1 | — | — | 100 | ||||||||||||||||||||||||||||||||||||||||||||||||||||||||||||||||||||||||||||||||||||||||||||
End of this Congress (two months later) | 48 | 51 | 1 | — | — | 100 | ||||||||||||||||||||||||||||||||||||||||||||||||||||||||||||||||||||||||||||||||||||||||||||
Not Up | 29 | 36 | 1 | — | — | 66 | ||||||||||||||||||||||||||||||||||||||||||||||||||||||||||||||||||||||||||||||||||||||||||||
Up | 19 | 15 | — | — | — | 34 | ||||||||||||||||||||||||||||||||||||||||||||||||||||||||||||||||||||||||||||||||||||||||||||
Incumbent retired |
Total before | 5 | 3 | — | — | — | 8 | |||||||||||||||||||||||||||||||||||||||||||||||||||||||||||||||||||||||||||||||||||||||||||
Held by same party | — | 1 | — | — | — | 1 | ||||||||||||||||||||||||||||||||||||||||||||||||||||||||||||||||||||||||||||||||||||||||||||
Replaced by other party | ![]() ![]() ![]() ![]() |
— | — | — | 7 | |||||||||||||||||||||||||||||||||||||||||||||||||||||||||||||||||||||||||||||||||||||||||||||
Result after | 2 | 6 | — | — | — | 8 | ||||||||||||||||||||||||||||||||||||||||||||||||||||||||||||||||||||||||||||||||||||||||||||
Incumbent ran |
Total before | 14 | 12[a] | — | — | — | 26 | |||||||||||||||||||||||||||||||||||||||||||||||||||||||||||||||||||||||||||||||||||||||||||
Won re-election | 13 | 12 | — | — | — | 25 | ||||||||||||||||||||||||||||||||||||||||||||||||||||||||||||||||||||||||||||||||||||||||||||
Lost re-election | ![]() ![]() |
— | — | — | 1 | |||||||||||||||||||||||||||||||||||||||||||||||||||||||||||||||||||||||||||||||||||||||||||||
Lost renomination, held by same party | — | — | — | — | — | 0 | ||||||||||||||||||||||||||||||||||||||||||||||||||||||||||||||||||||||||||||||||||||||||||||
Lost renomination, and party lost | — | — | — | — | — | 0 | ||||||||||||||||||||||||||||||||||||||||||||||||||||||||||||||||||||||||||||||||||||||||||||
Result after | 13 | 13 | — | — | — | 26 | ||||||||||||||||||||||||||||||||||||||||||||||||||||||||||||||||||||||||||||||||||||||||||||
Net gain/loss | ![]() |
![]() |
— | — | — | 4 | ||||||||||||||||||||||||||||||||||||||||||||||||||||||||||||||||||||||||||||||||||||||||||||
Total elected | 15 | 19 | — | — | — | 34 | ||||||||||||||||||||||||||||||||||||||||||||||||||||||||||||||||||||||||||||||||||||||||||||
Result | 44 | 55 | 1 | — | — | 100 | ||||||||||||||||||||||||||||||||||||||||||||||||||||||||||||||||||||||||||||||||||||||||||||
Popular vote |
Votes | 44,754,618 | 39,920,562 | 186,231 | 754,861 | 2,481,075 | 88,097,347 | |||||||||||||||||||||||||||||||||||||||||||||||||||||||||||||||||||||||||||||||||||||||||||
Share | 50.80% | 45.31% | 0.21% | 0.86% | 2.82% | 100% |
Sources:
Main article: 2004 United States House of Representatives elections |
Republicans gained a couple of seats in the House, mainly due to the 2003 Texas redistricting. Republicans won the national popular vote for the House of Representatives by a margin of 2.6 percentage points.[1]
Parties | Seats | Popular vote | ||||||
---|---|---|---|---|---|---|---|---|
2002 | 2004 | Net change |
Strength | Vote | % | Change | ||
Republican Party | 229 | 232 | ![]() |
53.3% | 55,958,144 | 49.4% | -0.6% | |
Democratic Party | 205 | 202 | ![]() |
46.4% | 52,969,786 | 46.8% | +1.6% | |
Libertarian Party | — | — | — | — | 1,056,844 | 0.9% | -0.5% | |
Independent | 1 | 1 | 0 | 0.2% | 674,202 | 0.6% | +0.1% | |
Green Party | — | — | — | — | 344,549 | 0.3% | -0.1% | |
Constitution Party | — | — | — | — | 187,006 | 0.2% | - | |
Reform Party | — | — | — | — | 85,539 | 0.1% | +0.1% | |
Independence Party | — | — | — | — | 76,053 | 0.1% | +0.1% | |
Others | — | — | — | — | 1,840,163 | 1.6% | -0.6% | |
Total | 434 | 435 | 0 | 100.0% | 113,192,286 | 100.0% | – | |
Source: Election Statistics - Office of the Clerk |
Main article: 2004 United States gubernatorial elections |
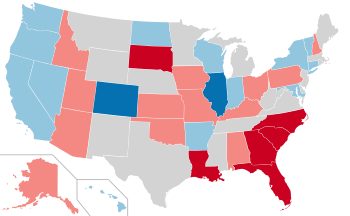
Eleven of the fifty United States governors were up for re-election, as were the governorships of two U.S. territories. The final results were a net change of zero between the political parties. The Democrats picked up the governorships in Montana and New Hampshire, but the Republicans picked up the ones in Indiana and Missouri.
State | Incumbent | Party | First
elected |
Result | Candidates |
---|---|---|---|---|---|
Delaware | Ruth Ann Minner | Democratic | 2000 | Incumbent re-elected. |
|
Indiana | Joe Kernan | Democratic | 2003[b] | Incumbent lost re-election.
New governor elected. Republican gain. |
|
Missouri | Bob Holden | Democratic | 2000 | Incumbent lost re-nomination.
New governor elected. Republican gain. |
|
Montana | Judy Martz | Republican | 2000 | Incumbent retired.
New governor elected. Democratic gain. |
|
New Hampshire | Craig Benson | Republican | 2002 | Incumbent lost re-election.
New governor elected. Democratic gain. |
|
North Carolina | Mike Easley | Democratic | 2000 | Incumbent re-elected. |
|
North Dakota | John Hoeven | Republican | 2000 | Incumbent re-elected. |
|
Utah | Olene Walker | Republican | 2003[c] | Incumbent lost re-nomination.
New governor elected. Republican hold. |
|
Vermont | Jim Douglas | Republican | 2002 | Incumbent re-elected. |
|
Washington | Gary Locke | Democratic | 2000 | Incumbent retired.
New governor elected. Democratic hold. |
|
West Virginia | Bob Wise | Democratic | 2000 | Incumbent retired.
New governor elected. Democratic hold. |
|
In many states where if the following positions were elective offices, voters cast votes for candidates for state executive branch offices of Lieutenant Governor (though some were voted for on the same ticket as the gubernatorial nominee), Secretary of state, state Treasurer, state Auditor, state Attorney General, state Superintendent of Education, Commissioners of Insurance, Agriculture or, Labor, etc.) and state judicial branch offices (seats on state Supreme Courts and, in some states, state appellate courts).
Elections to state legislatures were held on November 2, 2004, alongside other elections. Elections were held for 85 legislative chambers, with all states but Louisiana, Mississippi, New Jersey, Alabama, Maryland, and Virginia holding elections in at least one house. Michigan and Minnesota held elections for their lower, but not upper houses.[2]
Republicans won control of four chambers including the Oklahoma House of Representatives for the first since 1922; the Georgia House of Representatives for the first time since 1870; the Tennessee Senate for the time since 1870; and the Indiana House of Representatives.
Democrats took control of eight legislative chambers including the Washington Senate; the Oregon Senate, which was previously tied; both houses of the Montana legislature; both houses of the Colorado legislature for the first time since 1963; the North Carolina House of Representatives- which was previously tied; and the Vermont House of Representatives. Additionally, the Iowa Senate became tied after previously being controlled by the GOP before the election.[3]
The Democrats also regained the title of holding the most seats although their margin is a tiny fraction of 1 percent — a mere one seat at press time. Republicans won four legislative chambers.[4]Some of the major American cities that held their mayoral elections in 2004 included: