![]() | |||||||||||||||||
| |||||||||||||||||
Turnout | 63.47% (voting eligible)[1] | ||||||||||||||||
---|---|---|---|---|---|---|---|---|---|---|---|---|---|---|---|---|---|
| |||||||||||||||||
Sanders: 50–60% 60–70% 70–80% 80–90%
MacGovern: 80–90% | |||||||||||||||||
|
Elections in Vermont |
---|
![]() |
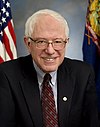
The 2012 United States Senate election in Vermont was held on November 6, 2012. Incumbent Independent U.S. Senator Bernie Sanders won re-election to a second term in a landslide, capturing nearly three-quarters of the vote.
Then-U.S. representative Bernie Sanders, an independent and self-described democratic socialist, had been elected with 65% of the vote in the 2006 U.S. senatorial election in Vermont.
Sanders also received the nomination of the Vermont Progressive Party, but declined both the Democratic and Progressive nominations after the primary.[3]
Party | Candidate | Votes | % | |
---|---|---|---|---|
Republican | John MacGovern | 6,343 | 75.4 | |
Republican | H. Brooke Paige | 2,073 | 24.6 | |
Total votes | 8,416 | 100.0 |
Source | Ranking | As of |
---|---|---|
The Cook Political Report[13] | Solid I | November 1, 2012 |
Sabato's Crystal Ball[14] | Safe I | November 5, 2012 |
Rothenberg Political Report[15] | Safe I | November 2, 2012 |
Real Clear Politics[16] | Safe I | November 5, 2012 |
Poll source | Date(s) administered |
Sample size |
Margin of error |
Randy Brock (R) |
Bernie Sanders (I) |
Other | Undecided |
---|---|---|---|---|---|---|---|
Public Policy Polling | July 28–31, 2011 | 1,233 | ±2.8% | 28% | 65% | — | 7% |
Poll source | Date(s) administered |
Sample size |
Margin of error |
Jim Douglas (R) |
Bernie Sanders (I) |
Other | Undecided |
---|---|---|---|---|---|---|---|
Public Policy Polling | July 28–31, 2011 | 1,233 | ±2.8% | 38% | 56% | — | 6% |
Poll source | Date(s) administered |
Sample size |
Margin of error |
Brian Dubie (R) |
Bernie Sanders (I) |
Other | Undecided |
---|---|---|---|---|---|---|---|
Public Policy Polling | July 28–31, 2011 | 1,233 | ±2.8% | 34% | 60% | — | 6% |
Poll source | Date(s) administered |
Sample size |
Margin of error |
Thom Lauzon (R) |
Bernie Sanders (I) |
Other | Undecided |
---|---|---|---|---|---|---|---|
Public Policy Polling | July 28–31, 2011 | 1,233 | ±2.8% | 24% | 63% | — | 13% |
Poll source | Date(s) administered |
Sample size |
Margin of error |
Tom Salmon (R) |
Bernie Sanders (I) |
Other | Undecided |
---|---|---|---|---|---|---|---|
Public Policy Polling | July 28–31, 2011 | 1,233 | ±2.8% | 28% | 62% | — | 10% |
Poll source | Date(s) administered |
Sample size |
Margin of error |
Phil Scott (R) |
Bernie Sanders (I) |
Other | Undecided |
---|---|---|---|---|---|---|---|
Public Policy Polling | July 28–31, 2011 | 1,233 | ±2.8% | 30% | 61% | — | 9% |
Poll source | Date(s) administered |
Sample size |
Margin of error |
Mark Snelling (R) |
Bernie Sanders (I) |
Other | Undecided |
---|---|---|---|---|---|---|---|
Public Policy Polling | July 28–31, 2011 | 1,233 | ±2.8% | 25% | 62% | — | 13% |
Party | Candidate | Votes | % | ±% | |
---|---|---|---|---|---|
Independent | Bernie Sanders (incumbent) | 207,848 | 71.00% | +5.59% | |
Republican | John MacGovern | 72,898 | 24.90% | -7.46% | |
Marijuana | Cris Ericson | 5,924 | 2.02% | N/A | |
Liberty Union | Peter Diamondstone | 2,511 | 0.86% | +0.55% | |
Peace and Prosperity | Peter Moss | 2,452 | 0.84% | +0.26% | |
VoteKISS | Laurel LaFramboise | 877 | 0.30% | N/A | |
Write-in | 252 | 0.08% | -0.02% | ||
Total votes | 292,762 | 100.00% | N/A | ||
Independent hold |