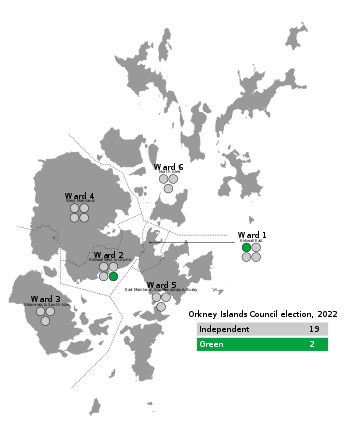
Orkney Islands Council election
2022 Orkney Islands Council election|
|
|
|
|
 Results by wards by partisanship.
 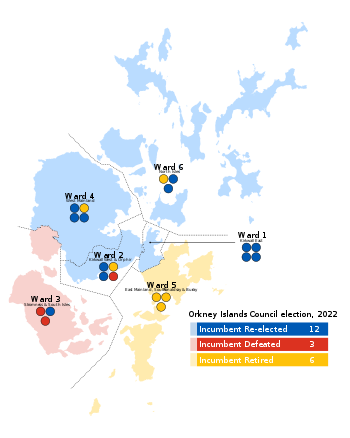 Results by wards, showing whether the incumbent candidate was re-elected, defeated, or retired
 |
Council Leader before election
James Stockan
Independent
|
Council Leader after election
James Stockan
Independent
| |
Elections to the Orkney Islands Council were held on 5 May 2022, the same day as the 31 other Scottish local government elections. The election used the six wards created under the Local Governance (Scotland) Act 2004, with 21 councillors being elected. Each ward elected either 3 or 4 members, using the STV electoral system.[2]
Ward boundaries differ slightly from previous elections, with minor changes being made to the two Kirkwall wards, as well as the boundary nearest Kirkwall in East Mainland, South Ronaldsay and Burray.[3]
At the previous election in 2017, independent councillors won the most seats and ran the council.
Background
Composition
There were no official changes to the political composition of the council in the preceding term. However, independent councillor John Ross Scott did announce he had joined the Greens in 2021, which did not change his affiliation on the council.[4] One by-election was held and resulted in an independent hold.[5]
Retiring councillors
Boundary changes
Following the passing of the Islands (Scotland) Act 2018, a review of the boundaries was undertaken in North Ayrshire, Argyll and Bute, Highland, Orkney Islands, Shetland Islands and Comhairle nan Eilean Siar. The Act allowed single- or two-member wards to be created to provide better representation of island communities. As a result, the boundaries of the existing wards were changed but the number of councillors remained the same. North Isles, Stromness and South Isles and West Mainland were unchanged. The boundaries in and around Kirkwall were amended to better reflect local ties. Kirkwall Airport and neighbouring communities were placed in Kirkwall wards instead of East Mainland, South Ronaldsay and Burray while the boundary between Kirkwall East and Kirkwall West and Orphir was amended by the harbour to make a more identifiable boundary.[3][6]

