Amber Valley Borough Council elections are held every four years to elect councillors to Amber Valley Borough Council, the local authority for the non-metropolitan district of Amber Valley in Derbyshire, England. Since the last boundary changes in 2023, 42 councillors have been elected to represent 18 wards. Prior to 2023 a third of the council was elected three years out of every four.[1]
Council election results
The party make up of the council after each election is as shown below.
| Election |
Labour |
Conservative |
Green Party |
Liberal Democrats |
Independent |
BNP
|
Total
|
Notes
|
|
|
|
|
|
|
|
| 1973 |
33 |
6 |
0 |
3 |
18 |
0 |
60 |
Inaugural election
|
| 1976 |
18 |
4 |
0 |
14 |
24 |
0 |
60 |
|
| 1979 |
18 |
12 |
0 |
7 |
6 |
0 |
43 |
New Boundaries
|
| 1980 |
24 |
11 |
0 |
4 |
4 |
0 |
43 |
|
| 1982 |
22 |
10 |
0 |
7 |
4 |
0 |
43 |
|
| 1983 |
23 |
7 |
0 |
8 |
5 |
0 |
43 |
|
| 1995 |
37 |
6 |
0 |
0 |
0 |
0 |
43 |
|
| 1996 |
37 |
6 |
0 |
0 |
0 |
0 |
43 |
|
| 1998 |
37 |
6 |
0 |
0 |
0 |
0 |
43 |
|
| 1999 |
32 |
11 |
0 |
0 |
0 |
0 |
43 |
|
| 2000 |
12 |
32 |
0 |
0 |
1 |
0 |
45 |
New Boundaries
|
| 2002 |
19 |
26 |
0 |
0 |
0 |
0 |
45 |
|
| 2003 |
25 |
20 |
0 |
0 |
0 |
0 |
45 |
|
| 2004 |
24 |
21 |
0 |
0 |
0 |
0 |
45 |
|
| 2006 |
18 |
27 |
0 |
0 |
0 |
0 |
45 |
|
| 2007 |
17 |
28 |
0 |
0 |
0 |
0 |
45 |
|
| 2008 |
14 |
29 |
0 |
0 |
0 |
0 |
45 |
|
| 2010 |
14 |
29 |
0 |
0 |
0 |
2 |
45 |
|
| 2011 |
15 |
28 |
0 |
0 |
0 |
2 |
45 |
|
| 2012 |
21 |
24 |
0 |
0 |
0 |
2 |
45 |
|
| 2014 |
23 |
22 |
0 |
0 |
0 |
0 |
45 |
|
| 2015 |
21 |
24 |
0 |
0 |
0 |
0 |
45 |
|
| 2016 |
22 |
23 |
0 |
0 |
0 |
0 |
45 |
|
| 2018 |
20 |
25 |
0 |
0 |
0 |
0 |
45 |
|
| 2019 |
25 |
19 |
1 |
0 |
0 |
0 |
45 |
|
| 2021 |
16 |
28 |
1 |
0 |
0 |
0 |
45 |
|
| 2022 |
11 |
30 |
3 |
0 |
1 |
0 |
45 |
|
| 2023 |
26 |
7 |
6 |
1 |
2 |
0 |
42 |
New Boundaries
|
|
|
|
|
|
|
|
|
|
Council elections in Derbyshire
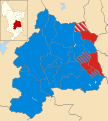 2000 results map
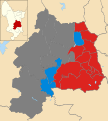 2002 results map
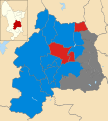 2003 results map
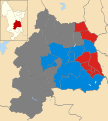 2004 results map
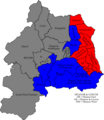 2006 results map
 2007 results map
 2008 results map
 2011 results map
 2012 results map
 2014 results map
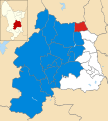 2015 results map
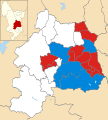 2016 results map
 2018 results map
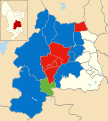 2019 results map
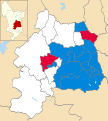 2021 results map
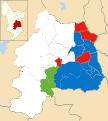 2022 results map
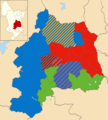 2023 results map


