Borough result maps
-
 2007 results map
 -
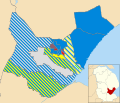 2011 results map
Boston Borough Council in Lincolnshire, England is elected every four years. Since the last boundary changes in 2015, 30 councillors are elected from 15 wards.
| Overall control | Conservative | Labour | Lib Dems | UKIP | English Democrats | Boston Bypass Independents | Boston Independent | Independent | |||||||||
| 2023 | Boston Independent | 5 | 0 | 1 | 0 | 0 | 0 | 24 | 0 | ||||||||
| 2019 | Conservative | 16 | 2 | 0 | 1 | 0 | 0 | 0 | 11 | ||||||||
| 2015 | NOC | 13 | 2 | 0 | 13 | 0 | 0 | 0 | 2 | ||||||||
| 2011 | Conservative | 19 | 3 | 0 | 0 | 2 | 4 | 0 | 4 | ||||||||
| 2007 | Boston Bypass Independents | 5 | 0 | 0 | 0 | 0 | 25 | 0 | 2 | ||||||||
| 2003 | NOC | 12 | 11 | 4 | 0 | 0 | 0 | 0 | 5 | ||||||||


| Party | Candidate | Votes | % | ±% | |
|---|---|---|---|---|---|
| Independent | 495 | 57.5 | |||
| Independent | 142 | 16.5 | |||
| Liberal Democrats | 118 | 13.7 | |||
| Labour | 106 | 12.3 | |||
| Majority | 353 | 41.0 | |||
| Turnout | 861 | ||||
| Independent hold | Swing | ||||
| Party | Candidate | Votes | % | ±% | |
|---|---|---|---|---|---|
| Conservative | 363 | 59.0 | |||
| Labour | 252 | 41.0 | |||
| Majority | 111 | 18.0 | |||
| Turnout | 615 | ||||
| Conservative gain from Independent | Swing | ||||
| Party | Candidate | Votes | % | ±% | |
|---|---|---|---|---|---|
| Conservative | 580 | 66.8 | |||
| Labour | 288 | 33.2 | |||
| Majority | 292 | 33.6 | |||
| Turnout | 868 | ||||
| Conservative gain from Liberal Democrats | Swing | ||||
| Party | Candidate | Votes | % | ±% | |
|---|---|---|---|---|---|
| Conservative | 181 | 34.3 | |||
| Liberal Democrats | 158 | 30.0 | |||
| Independent | 141 | 26.8 | |||
| Labour | 47 | 8.9 | |||
| Majority | 23 | 4.3 | |||
| Turnout | 527 | 19.2 | |||
| Conservative gain from Independent | Swing | ||||
| Party | Candidate | Votes | % | ±% | |
|---|---|---|---|---|---|
| Conservative | 116 | 43.3 | |||
| Labour | 96 | 35.8 | |||
| Liberal Democrats | 33 | 12.3 | |||
| Independent | 23 | 8.6 | |||
| Majority | 20 | 7.5 | |||
| Turnout | 268 | 19.8 | |||
| Conservative gain from Labour | Swing | ||||
| Party | Candidate | Votes | % | ±% | |
|---|---|---|---|---|---|
| Conservative | 182 | 38.1 | |||
| Labour | 149 | 31.2 | |||
| Liberal Democrats | 147 | 30.8 | |||
| Majority | 33 | 6.9 | |||
| Turnout | 478 | 32.7 | |||
| Conservative hold | Swing | ||||
| Party | Candidate | Votes | % | ±% | |
|---|---|---|---|---|---|
| Labour | 330 | 46.0 | |||
| Conservative | 251 | 35.0 | |||
| Independent | 137 | 19.1 | |||
| Majority | 79 | 11.0 | |||
| Turnout | 718 | 26.9 | |||
| Labour hold | Swing | ||||
| Party | Candidate | Votes | % | ±% | |
|---|---|---|---|---|---|
| Labour | Michael Gall | 316 | 33.1 | +16.6 | |
| Liberal Democrats | Robert Dodson | 310 | 32.5 | +0.9 | |
| Conservative | Terence Taylor | 254 | 26.6 | -25.3 | |
| UKIP | Don Ransome | 75 | 7.8 | +7.8 | |
| Majority | 6 | 0.6 | |||
| Turnout | 955 | 20.5 | |||
| Labour gain from Conservative | Swing | ||||
| Party | Candidate | Votes | % | ±% | |
|---|---|---|---|---|---|
| Conservative | John Rylatt | 505 | 72.8 | +30.5 | |
| Labour | Catrina Holstead | 104 | 15.0 | -2.5 | |
| Independent | John Fitzgerald | 85 | 12.2 | -28.0 | |
| Majority | 401 | 57.8 | |||
| Turnout | 694 | 20.6 | |||
| Conservative hold | Swing | ||||
| Party | Candidate | Votes | % | ±% | |
|---|---|---|---|---|---|
| Conservative | Frank Pickett | 366 | 55.2 | -12.8 | |
| UKIP | Sue Ransome | 115 | 17.3 | +2.6 | |
| Labour | Clive Marshall | 99 | 14.9 | +14.9 | |
| Liberal Democrats | Paul Appleby | 83 | 12.5 | +12.5 | |
| Majority | 251 | 37.9 | |||
| Turnout | 663 | 25.5 | |||
| Conservative hold | Swing | ||||
| Party | Candidate | Votes | % | ±% | |
|---|---|---|---|---|---|
| Conservative | Raymond Singleton-McGuire | 495 | 44.7 | +6.8 | |
| Liberal Democrats | Malcolm Chapman | 428 | 38.7 | -2.1 | |
| UKIP | John Flynn | 184 | 16.6 | +16.6 | |
| Majority | 67 | 6.0 | |||
| Turnout | 1,107 | 23.6 | |||
| Conservative hold | Swing | ||||
| Party | Candidate | Votes | % | ±% | |
|---|---|---|---|---|---|
| Conservative | Raymond Singleton-McGuire | 344 | 30.9 | -1.6 | |
| Boston Bypass Independents | David Durrant | 306 | 27.5 | -32.9 | |
| Liberal Democrats | Ossy Snell | 213 | 19.1 | +19.1 | |
| BNP | David Owens | 119 | 10.7 | +10.7 | |
| UKIP | Felicity Ransome | 88 | 7.9 | +0.7 | |
| Labour | Pam Imlah | 44 | 3.9 | +3.9 | |
| Majority | 38 | 3.4 | |||
| Turnout | 1,114 | 37.3 | -4.5 | ||
| Conservative gain from Boston Bypass Independents | Swing | ||||
| Party | Candidate | Votes | % | ±% | |
|---|---|---|---|---|---|
| BNP | David Owens | 279 | 42.6 | +42.6 | |
| Boston Bypass Independents | Carl Smith | 141 | 21.5 | -21.8 | |
| Conservative | Paul Mould | 119 | 18.2 | -0.1 | |
| Labour | Norman Hart | 69 | 10.5 | -13.2 | |
| UKIP | Cyril Wakefield | 24 | 3.7 | -11.0 | |
| Liberal Democrats | Gavin Carrington | 23 | 3.5 | +3.5 | |
| Majority | 138 | 21.1 | |||
| Turnout | 655 | 22.1 | -0.5 | ||
| BNP gain from Boston Bypass Independents | Swing | ||||
| Party | Candidate | Votes | % | ±% | |
|---|---|---|---|---|---|
| Conservative | Colin Brotherton | 490 | 42.2 | +8.9 | |
| Boston Bypass Independents | Carl Smith | 243 | 20.9 | -45.7 | |
| UKIP | Sue Ransome | 230 | 19.8 | +19.8 | |
| Independent | Frank Martin | 122 | 13.1 | +13.1 | |
| Labour | Elizabeth Leonard | 75 | 6.5 | +6.5 | |
| Majority | 247 | 21.3 | |||
| Turnout | 1,160 | 31.7 | +0.9 | ||
| Conservative hold | Swing | ||||
| Party | Candidate | Votes | % | ±% | |
|---|---|---|---|---|---|
| Conservative | Myles Larrington | 110 | 32.4 | -16.7 | |
| Labour | Paul Kenny | 76 | 22.4 | +13.0 | |
| UKIP | Felicity Ransome | 59 | 17.4 | +17.4 | |
| Boston Bypass Independents | Trevor Page | 53 | 15.6 | -26.1 | |
| Liberal Democrats | Mike Sheridan-Shinn | 42 | 12.4 | +12.4 | |
| Majority | 34 | 10.0 | |||
| Turnout | 340 | 27.4 | +0.3 | ||
| Conservative hold | Swing | ||||
| Party | Candidate | Votes | % | ±% | |
|---|---|---|---|---|---|
| Independent | Stuart Ashton | 204 | 39.2 | -17.8 | |
| Independent | Maggie Peberdy | 139 | 26.7 | -2.2 | |
| Conservative | Claire Rylott | 126 | 24.2 | +24.2 | |
| UKIP | Sue Ransome | 32 | 6.2 | -7.9 | |
| Labour | Mike Sheridan-Shinn | 19 | 3.7 | +3.7 | |
| Majority | 65 | 12.5 | |||
| Turnout | 520 | 35.6 | -13.2 | ||
| Independent hold | Swing | ||||
| Party | Candidate | Votes | % | ±% | |
|---|---|---|---|---|---|
| UKIP | Bob Mcauley | 376 | 44.4 | +44.4 | |
| Labour Co-op | Pam Kenny | 202 | 23.8 | -2.5 | |
| Independent | Robert Lauberts | 145 | 17.1 | +17.1 | |
| Conservative | Carl Richmond | 124 | 14.6 | -16.3 | |
| Majority | 174 | 20.6 | |||
| Turnout | 847 | 29.9 | -5.4 | ||
| UKIP gain from Conservative | Swing | ||||
| Party | Candidate | Votes | % | ±% | |
|---|---|---|---|---|---|
| UKIP | Tiggs Keywood-Wainwright | 162 | 39.4 | +39.4 | |
| Conservative | Dan Elkington | 87 | 21.2 | +21.2 | |
| Liberal Democrats | Alan Taylor | 87 | 21.2 | +11.4 | |
| Labour | Ben Cook | 75 | 18.2 | -8.0 | |
| Majority | 75 | 18.2 | |||
| Turnout | 411 | 13.7 | -11.2 | ||
| UKIP gain from English Democrat | Swing | ||||
| Party | Candidate | Votes | % | ±% | |
|---|---|---|---|---|---|
| Conservative | Tom Ashton | 536 | 74.2 | +21.3 | |
| Labour | Joseph Pearson | 123 | 17.0 | +17.0 | |
| UKIP | Don Ransome | 50 | 6.9 | -40.2 | |
| Blue Revolution | Richard Thornalley | 13 | 1.8 | +1.8 | |
| Majority | 413 | 57.2 | |||
| Turnout | 722 | ||||
| Conservative hold | Swing | ||||
| Party | Candidate | Votes | % | ±% | |
|---|---|---|---|---|---|
| Conservative | David Brown | 2,018 | 69.9 | +35.7 | |
| Independent | Lorraine O'Connor | 453 | 15.7 | +15.7 | |
| Liberal Democrats | Alan Taylor | 415 | 14.4 | +14.4 | |
| Majority | 1,565 | 54.2 | |||
| Turnout | 2,886 | ||||
| Conservative hold | Swing | ||||
| Party | Candidate | Votes | % | ±% | |
|---|---|---|---|---|---|
| Conservative | Martin Howard | 955 | 51.3 | +27.3 | |
| Labour | Jackie Barton | 437 | 23.5 | +2.0 | |
| Independent | Don Jenkins | 195 | 10.5 | +10.5 | |
| Independent | Sue Ransome | 112 | 6.0 | +6.0 | |
| Liberal Democrats | Jason Stevenson | 100 | 5.4 | +5.4 | |
| Blue Revolution | Christopher Moore | 62 | 3.3 | -11.2 | |
| Majority | 518 | 27.8 | |||
| Turnout | 1,861 | ||||
| Conservative hold | Swing | ||||
| Party | Candidate | Votes | % | ±% | |
|---|---|---|---|---|---|
| Conservative | Katie Chalmers | 338 | 34.5 | +10.5 | |
| Independent | Dale Broughton | 307 | 31.4 | +31.4 | |
| Labour | Jackie Barton | 210 | 21.5 | +0.0 | |
| For the People Not the Party | Christopher Moore | 88 | 9.0 | +9.0 | |
| Independent | Christopher Cardwell | 36 | 3.7 | +3.7 | |
| Majority | 31 | 3.2 | |||
| Turnout | 979 | ||||
| Conservative gain from Independent | Swing | ||||