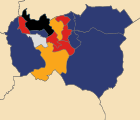
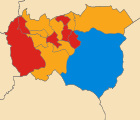
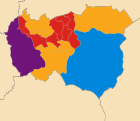
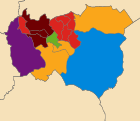
Burnley Borough Council elections are generally held three years out of every four, with a third of the council elected each time. Burnley Borough Council is the local authority for the non-metropolitan district of Burnley in Lancashire, England. Since the last boundary changes in 2002, 45 councillors have been elected from 15 wards.[1]
From 1889 to 1974 Burnley was a county borough, independent of any county council.[2] Under the Local Government Act 1972 it had its territory enlarged, gaining Padiham Urban District and much of Burnley Rural District, and at the same time became a non-metropolitan district, with Lancashire County Council providing county-level services.[3][4] The first election to the reformed borough council was held in 1973, initially operating as a shadow authority before the new arrangements took effect on 1 April 1974. Political control of the council since 1973 has been held by the following parties:[5][6]
Party | Period | |
---|---|---|
Labour | 1973–2000 | |
No overall control | 2000–2001 | |
Labour | 2001–2004 | |
No overall control | 2003–2004 | |
Liberal Democrats | 2008–2011 | |
No overall control | 2011–2012 | |
Labour | 2012–2019 | |
No overall control | 2019–present |
The leaders of the council since 2006 have been:[7]
Councillor | Party | From | To | |
---|---|---|---|---|
Stuart Caddy | Labour | 7 May 2006 | ||
Gordon Birtwistle | Liberal Democrats | May 2006 | 2010 | |
Charlie Briggs | Liberal Democrats | 2010 | 2012 | |
Julie Cooper | Labour | 2012 | 2014 | |
Mark Townsend[8] | Labour | 2014 | 15 May 2019 | |
Charlie Briggs[9] | Burnley and Padiham Independent Party | 29 May 2019 | 18 Sep 2020 | |
Mark Townsend | Labour | 30 Sep 2020 | 19 May 2021 | |
Afrasiab Anwar | Labour | 19 May 2021 |
Party | Candidate | Votes | % | ±% | |
---|---|---|---|---|---|
Conservative | 611 | 59.4 | +11.6 | ||
Labour | 417 | 40.6 | -11.6 | ||
Majority | 194 | 18.8 | |||
Turnout | 1,028 | ||||
Conservative gain from Labour | Swing |
Party | Candidate | Votes | % | ±% | |
---|---|---|---|---|---|
Independent | Samuel Holgate | 467 | 38.8 | −33.0 | |
Labour | 421 | 35.0 | +6.8 | ||
BNP | 283 | 23.5 | +23.5 | ||
Socialist Alliance | 32 | 2.7 | +2.7 | ||
Majority | 46 | 3.8 | |||
Turnout | 1,203 | 27.8 | |||
Independent hold | Swing |
Party | Candidate | Votes | % | ±% | |
---|---|---|---|---|---|
Labour | Elizabeth Monk | 555 | 57.9 | +1.3 | |
BNP | 181 | 18.9 | +18.9 | ||
Independent | 172 | 18.0 | +18.0 | ||
Socialist Alliance | 50 | 5.2 | +5.2 | ||
Majority | 374 | 39.0 | |||
Turnout | 958 | 28.8 | |||
Labour hold | Swing |
Party | Candidate | Votes | % | ±% | |
---|---|---|---|---|---|
Labour | Denis Otter | 380 | 31.7 | +9.0 | |
Independent | 284 | 23.7 | -24.1 | ||
BNP | 230 | 19.2 | +19.2 | ||
Liberal Democrats | 203 | 16.9 | +16.9 | ||
Conservative | 101 | 8.4 | -21.1 | ||
Majority | 96 | 8.0 | |||
Turnout | 1,198 | 28.8 | |||
Labour gain from Independent | Swing |
Party | Candidate | Votes | % | ±% | |
---|---|---|---|---|---|
Liberal Democrats | Peter McCann | 788 | 33.1 | +33.1 | |
BNP | Andy Kenyon | 777 | 32.6 | -6.4 | |
Labour | Andy Tatchell | 679 | 28.5 | -5.9 | |
Independent | Patricia Stinton | 76 | 3.2 | -15.6 | |
Conservative | Alan Marsden | 62 | 2.6 | -5.2 | |
Majority | 11 | 0.5 | |||
Turnout | 2,382 | 53.5 | |||
Liberal Democrats gain from Labour | Swing |
Party | Candidate | Votes | % | ±% | |
---|---|---|---|---|---|
Liberal Democrats | Martin Smith | 1,070 | 50.6 | +32.0 | |
Labour | Julie Cooper | 464 | 21.9 | -9.8 | |
BNP | John Cave | 357 | 16.9 | -17.1 | |
Independent | Ann Royle | 127 | 6.0 | -9.8 | |
Conservative | Paul Coates | 98 | 4.6 | +4.6 | |
Majority | 606 | 28.7 | |||
Turnout | 2,116 | 48.2 | |||
Liberal Democrats gain from BNP | Swing |
Party | Candidate | Votes | % | ±% | |
---|---|---|---|---|---|
Labour | Julie Cooper | 1,056 | 48.0 | −2.2 | |
Liberal Democrats | Abdul Hamid | 514 | 23.3 | −2.7 | |
BNP | Derek Dawson | 368 | 16.7 | +16.7 | |
Conservative | Paul Coates | 266 | 12.0 | −11.8 | |
Majority | 542 | 24.7 | |||
Turnout | 2,204 | 53.5 | |||
Labour hold | Swing |
Party | Candidate | Votes | % | ±% | |
---|---|---|---|---|---|
Liberal Democrats | Allen Harris | 875 | 44.1 | +16.3 | |
BNP | Paul McDevitt | 538 | 27.1 | +0.6 | |
Labour | Karen Baker | 479 | 24.2 | −6.7 | |
Conservative | Tony Coulson | 90 | 4.5 | -10.2 | |
Majority | 337 | 17.0 | |||
Turnout | 1,982 | 39.9 | |||
Liberal Democrats gain from Labour | Swing |
Party | Candidate | Votes | % | ±% | |
---|---|---|---|---|---|
Labour | Shah Hussain | 944 | 46.6 | -3.7 | |
Liberal Democrats | Mohammed Malik | 906 | 44.7 | -5.0 | |
England First | Steven Smith | 141 | 7.0 | +7.0 | |
Conservative | Alan Marsden | 35 | 1.7 | +1.7 | |
Majority | 38 | 1.9 | |||
Turnout | 2,026 | 52.4 | |||
Labour gain from Liberal Democrats | Swing |
Party | Candidate | Votes | % | ±% | |
---|---|---|---|---|---|
Liberal Democrats | Iris Gates | 645 | 41.2 | +1.1 | |
BNP | John Cave | 400 | 25.6 | -5.4 | |
Labour | Charles Baker | 304 | 19.4 | +1.0 | |
Conservative | Barry Elliott | 215 | 13.7 | +3.4 | |
Majority | 245 | 15.6 | |||
Turnout | 1,564 | 32.8 | |||
Liberal Democrats hold | Swing |
Party | Candidate | Votes | % | ±% | |
---|---|---|---|---|---|
Labour | Beatrice Foster | 521 | 43.1 | +11.8 | |
BNP | Paul McDevitt | 288 | 23.8 | +5.4 | |
Liberal Democrats | Kate Mottershead | 261 | 21.6 | -11.8 | |
Conservative | Mathew Isherwood | 81 | 6.7 | -10.2 | |
Independent | Andrew Hennessey | 58 | 4.8 | +4.8 | |
Majority | 233 | 19.3 | |||
Turnout | 1,209 | ||||
Labour gain from Liberal Democrats | Swing |
Party | Candidate | Votes | % | ±% | |
---|---|---|---|---|---|
Labour | Tony Martin | 493 | 49.3 | -8.8 | |
Liberal Democrats | Stephanie Forrest | 256 | 25.6 | -5.8 | |
Conservative | Tom Watson | 96 | 9.6 | +9.6 | |
BNP | Derek Dawson | 95 | 9.5 | -1.1 | |
UKIP | Craig Ramplee | 35 | 3.5 | 3.5 | |
National Front | Steven Smith | 26 | 2.6 | +2.6 | |
Majority | 237 | 23.7 | |||
Turnout | 1,001 | ||||
Labour hold | Swing |
Party | Candidate | Votes | % | ±% | |
---|---|---|---|---|---|
Liberal Democrats | Peter McCann | 341 | 37.5 | -11.0 | |
Labour | Andy Devanney | 249 | 27.4 | -6.8 | |
BAPIP | Paula Riley | 154 | 16.9 | +16.9 | |
Conservative | Phil Chamberlain | 115 | 12.6 | -0.4 | |
Green | Victoria Alker | 51 | 5.6 | +1.3 | |
Majority | 92 | 10.1 | |||
Turnout | 910 | ||||
Liberal Democrats hold | Swing |