County result maps
-
 2005 results map
 -
 2009 results map
 -
 2013 results map
 -
 2017 results map
 -
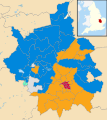 2021 results map
Cambridgeshire County Council is elected every four years using the first past the post system of election. As of 2021 the council consists of 61 council seats, representing 59 electoral divisions.
| Election | Conservative | Labour | Liberal Democrat[1] | UKIP | Green | Other | Total |
|---|---|---|---|---|---|---|---|
| 1973[2] | 28 | 22 | 5 | 0 | 0 | 13 | 68 |
| 1977[2] | 56 | 7 | 1 | 0 | 0 | 4 | 68 |
| 1981[2] | 35 | 19 | 11 | 0 | 0 | 3 | 68 |
| 1985[2] | 29 | 21 | 26 | 0 | 0 | 1 | 77 |
| 1989[2] | 46 | 20 | 10 | 0 | 0 | 1 | 77 |
| 1993[3] | 33 | 21 | 20 | 0 | 0 | 3[4] | 77 |
| 1997[3][5][6] | 33 | 10 | 16 | 0 | 0 | 0 | 59 |
| 2001[5][6] | 34 | 9 | 16 | 0 | 0 | 0 | 59 |
| 2005[7] | 42 | 4 | 23 | 0 | 0 | 0 | 69 |
| 2009[8] | 42 | 2 | 23 | 1 | 1 | 0 | 69 |
| 2013[9] | 32 | 7 | 14 | 12 | 0 | 4 | 69 |
| 2017[10] | 36 | 7 | 15 | 0 | 0 | 3 | 61 |
| 2021 | 28 | 9 | 20 | 0 | 0 | 4 | 61 |


The following is an incomplete list of by-elections to Cambridgeshire County Council.
| Party | Candidate | Votes | % | ±% | |
|---|---|---|---|---|---|
| Conservative | Jane Brookes | 1,056 | 63.5 | ||
| Labour | L. Ann Pettifor | 493 | 29.6 | ||
| Liberal | Bernard Greaves | 115 | 6.9 | ||
| Majority | 563 | 33.8 | |||
| Turnout | |||||
| Conservative hold | Swing | ||||
| Party | Candidate | Votes | % | ±% | |
|---|---|---|---|---|---|
| Labour | John Hopkins | 794 | 50.2 | ||
| Conservative | Gerald Cotman | 501 | 31.6 | ||
| Liberal | Alan Charlesworth | 288 | 18.1 | ||
| Majority | 293 | 18.5 | |||
| Turnout | |||||
| Labour hold | Swing | ||||
| Party | Candidate | Votes | % | ±% | |
|---|---|---|---|---|---|
| Labour | Colin Shaw | 723 | 72.2 | +6.9 | |
| Conservative | Simon Mitton | 175 | 17.5 | −3.4 | |
| Liberal Democrats | Evelyn Knowles | 104 | 10.4 | −3.4 | |
| Majority | 548 | 54.7 | +10.3 | ||
| Turnout | 1,002 | 20.6 | |||
| Labour hold | Swing | ||||
| Party | Candidate | Votes | % | ±% | |
|---|---|---|---|---|---|
| Liberal Democrats | R L Trueman[15] | 1,206 | 51.0 | +14.1 | |
| Conservative | 922 | 39.0 | +5.4 | ||
| Labour | 236 | 10.0 | −6.6 | ||
| Majority | 284 | 12.0 | |||
| Turnout | 2,364 | 32.0 | |||
| Liberal Democrats hold | Swing | ||||
| Party | Candidate | Votes | % | ±% | |
|---|---|---|---|---|---|
| Conservative | S M Campbell[15] | 1,300 | 52.0 | −3.9 | |
| Liberal Democrats | 1,202 | 48.0 | +18.8 | ||
| Majority | 98 | 4.0 | |||
| Turnout | 2,502 | 34.0 | |||
| Conservative hold | Swing | ||||
| Party | Candidate | Votes | % | ±% | |
|---|---|---|---|---|---|
| Conservative | Fred Yeulett[18] | 769 | 56.2 | +13.1 | |
| Labour | 313 | 22.9 | −13.5 | ||
| Liberal Democrats | 177 | 12.9 | −0.4 | ||
| Independent | 109 | 8.0 | +8.0 | ||
| Majority | 456 | 33.3 | |||
| Turnout | 1,368 | 17.3 | |||
| Conservative hold | Swing | ||||
| Party | Candidate | Votes | % | ±% | |
|---|---|---|---|---|---|
| Liberal Democrats | Alexander Reid | 930 | 51.3 | −3.8 | |
| Conservative | C. Gail Kenney | 376 | 20.7 | +1.5 | |
| Labour | Daphne Roper | 290 | 16.0 | −9.6 | |
| Green | Anna Gomori-Woodcock | 218 | 12.0 | +12.0 | |
| Majority | 554 | 30.6 | +1.1 | ||
| Turnout | 1,814 | 23.6 | |||
| Liberal Democrats hold | Swing | ||||
| Party | Candidate | Votes | % | ±% | |
|---|---|---|---|---|---|
| Liberal Democrats | Anthony Stuart Milton | 1,298 | 56.9 | +19.5 | |
| Conservative | David Leon Porter | 985 | 43.1 | +2.9 | |
| Majority | 313 | 13.8 | |||
| Turnout | 2,283 | 30.7 | |||
| Liberal Democrats gain from Conservative | Swing | ||||
| Party | Candidate | Votes | % | ±% | |
|---|---|---|---|---|---|
| Conservative | Colin Barker | 1,392 | 45.5 | +16.3 | |
| Liberal Democrats | Frances Amrani | 1,057 | 34.5 | +22.0 | |
| Labour | Martin Evans | 613 | 20.0 | −25.5 | |
| Majority | 335 | 11.0 | |||
| Turnout | 3,062 | 46.0 | |||
| Conservative gain from Labour | Swing | ||||
| Party | Candidate | Votes | % | ±% | |
|---|---|---|---|---|---|
| Liberal Democrats | John White | 922 | 55.8 | −1.5 | |
| Conservative | Robert Boorman | 280 | 16.9 | −2.5 | |
| Labour | Jane Jacks | 276 | 16.7 | −6.6 | |
| Green | Stephen Lawrence | 117 | 7.1 | +7.1 | |
| UKIP | Helene Davies | 58 | 3.5 | +3.5 | |
| Majority | 642 | 38.9 | +4.9 | ||
| Turnout | 1,653 | 23.7 | |||
| Liberal Democrats hold | Swing | ||||
| Party | Candidate | Votes | % | ±% | |
|---|---|---|---|---|---|
| Liberal Democrats | Simon Higginson | 1,140 | 60.0 | +3.8 | |
| Conservative | Roderick Mair | 583 | 30.7 | −13.1 | |
| Green | Andrew Allen | 105 | 5.5 | +5.5 | |
| Labour | Fiona Ross | 72 | 3.8 | +3.8 | |
| Majority | 557 | 29.3 | |||
| Turnout | 1,900 | 32.5 | |||
| Liberal Democrats hold | Swing | ||||
| Party | Candidate | Votes | % | ±% | |
|---|---|---|---|---|---|
| Liberal Democrats | Alice Douglas | 955 | 40.2 | −4.8 | |
| Labour | Paul Gilchrist | 656 | 27.6 | −5.7 | |
| Green | Jesse Griffiths | 265 | 11.2 | +0.4 | |
| Conservative | Richard Normington | 258 | 10.9 | +1.2 | |
| Respect | Denise Knowelden | 240 | 10.1 | +10.1 | |
| Majority | 299 | 12.6 | |||
| Turnout | 2,374 | 37.1 | |||
| Liberal Democrats hold | Swing | ||||
| Party | Candidate | Votes | % | ±% | |
|---|---|---|---|---|---|
| Conservative | Stephen Criswell | 1,377 | 68.0 | +18.8 | |
| Liberal Democrats | Anthony Hulme | 566 | 28.0 | −9.4 | |
| Labour | Richard Allen | 81 | 4.0 | −9.4 | |
| Majority | 811 | 40.0 | |||
| Turnout | 2,024 | 28.2 | |||
| Conservative hold | Swing | ||||
| Party | Candidate | Votes | % | ±% | |
|---|---|---|---|---|---|
| Conservative | Kenneth Churchill | 2,412 | 52.9 | +3.3 | |
| Liberal Democrats | Robert Eaton | 1,885 | 41.4 | +8.5 | |
| Labour | Richard Allen | 260 | 5.7 | −11.8 | |
| Majority | 527 | 11.5 | |||
| Turnout | 4,557 | 37.5 | |||
| Conservative hold | Swing | ||||
| Party | Candidate | Votes | % | ±% | |
|---|---|---|---|---|---|
| Conservative | Philip Read | 1,077 | 47.5 | +4.3 | |
| Liberal Democrats | Ian Dewar | 574 | 25.3 | −31.5 | |
| Independent | Kenneth Winters | 485 | 21.4 | +21.4 | |
| Labour | Fiona Ross | 130 | 5.7 | +5.7 | |
| Majority | 503 | 22.2 | |||
| Turnout | 2,266 | 36.6 | |||
| Conservative gain from Liberal Democrats | Swing | ||||
| Party | Candidate | Votes | % | ±% | |
|---|---|---|---|---|---|
| Conservative | Peter Humphrey | 897 | 61.1 | +2.1 | |
| Labour | Barry Diggle | 380 | 25.9 | +25.9 | |
| UKIP | Paul Clapp | 192 | 13.1 | +13.1 | |
| Majority | 517 | 35.2 | |||
| Turnout | 1,469 | 21.9 | |||
| Conservative hold | Swing | ||||
| Party | Candidate | Votes | % | ±% | |
|---|---|---|---|---|---|
| Liberal Democrats | Kilian Bourke | 781 | 37.0 | −8.0 | |
| Labour | Chris Freeman | 597 | 28.3 | −5.0 | |
| Conservative | Mike Morley | 289 | 13.7 | +4.0 | |
| Green | Keith Garrett | 237 | 11.2 | +0.4 | |
| Left List | Andrew Osborne | 207 | 9.8 | +9.8 | |
| Majority | 184 | 8.7 | |||
| Turnout | 2,111 | 33.1 | |||
| Liberal Democrats hold | Swing | ||||
| Party | Candidate | Votes | % | ±% | |
|---|---|---|---|---|---|
| Liberal Democrats | Fiona Whelan | 1,369 | 49.9 | +14.5 | |
| Conservative | John Ionides | 1,169 | 42.6 | +1.3 | |
| Labour | Helen Haugh | 208 | 7.6 | −7.4 | |
| Majority | 200 | 7.3 | |||
| Turnout | 2,746 | 36.0 | |||
| Liberal Democrats gain from Conservative | Swing | ||||
| Party | Candidate | Votes | % | ±% | |
|---|---|---|---|---|---|
| UKIP | Peter Reeve | 865 | 45.3 | +45.3 | |
| Conservative | Susan Normington | 682 | 35.7 | −10.6 | |
| Liberal Democrats | Anthony Hulme | 308 | 16.1 | −21.5 | |
| Labour | Susan Coomey | 53 | 2.8 | −13.3 | |
| Majority | 183 | 9.6 | |||
| Turnout | 1,908 | 30.1 | |||
| UKIP gain from Conservative | Swing | ||||
| Party | Candidate | Votes | % | ±% | |
|---|---|---|---|---|---|
| Conservative | Samantha Hoy | 548 | 34.8 | −6.9 | |
| Liberal Democrats | David Patrick | 506 | 32.1 | +20.0 | |
| Labour | Barry Diggle | 287 | 18.2 | +2.7 | |
| UKIP | Paul Clapp | 233 | 14.8 | −15.9 | |
| Majority | 42 | 2.7 | |||
| Turnout | 1,574 | 21.1 | |||
| Conservative hold | Swing | ||||
By-election called following the death of Leslie Sims.
| Party | Candidate | Votes | % | ±% | |
|---|---|---|---|---|---|
| Liberal Democrats | Ian Manning | 832 | 40.9 | +5.1 | |
| Labour | Gerri Bird | 663 | 32.6 | +17.6 | |
| Conservative | Matthew Bradney | 334 | 16.4 | −8.4 | |
| Green | Peter Pope | 117 | 5.7 | −9.0 | |
| Cambridge Socialists | Anna Gordon | 53 | 2.6 | +2.6 | |
| UKIP | Peter Burkinshaw | 37 | 1.8 | −8.0 | |
| Majority | 169 | 8.3 | |||
| Turnout | 2,036 | 30.5 | |||
| Liberal Democrats hold | Swing | ||||
By-election called following the resignation of Siep Wijsenbeek.
| Party | Candidate | Votes | % | ±% | |
|---|---|---|---|---|---|
| Conservative | Steve Count | 616 | 52.4 | −3.4 | |
| Labour | Louis Sugden | 282 | 24.0 | +10.3 | |
| Liberal Democrats | William McAdam | 277 | 23.6 | −6.9 | |
| Majority | 334 | 28.4 | |||
| Turnout | 1,175 | 21.0 | |||
| Conservative hold | Swing | ||||
By-election following death of John West
| Party | Candidate | Votes | % | ±% | |
|---|---|---|---|---|---|
| Labour | Paul Sales | 1,214 | 37.9 | +8.9 | |
| Liberal Democrats | Amy Ellis | 1,078 | 33.7 | −8.3 | |
| Conservative | Shapour Meftah | 496 | 15.5 | −0.3 | |
| Green | Martin Bonner | 411 | 12.8 | −0.4 | |
| Majority | 136 | 4.3 | |||
| Turnout | 3,199 | 47.0 | |||
| Labour gain from Liberal Democrats | Swing | ||||
| Party | Candidate | Votes | % | ±% | |
|---|---|---|---|---|---|
| Conservative | Peter Hudson | 1,252 | 41.8 | +2.2 | |
| UKIP | Martin Hale | 642 | 21.4 | −7.1 | |
| Labour | Ben Monks | 471 | 15.7 | −1.7 | |
| Liberal Democrats | Susan Gymer | 338 | 11.3 | +4.7 | |
| Green | Helen Stocks | 295 | 9.8 | +1.9 | |
| Majority | 610 | 20.3 | |||
| Turnout | 2,998 | 38.4 | |||
| Conservative hold | Swing | ||||
By-election following resignation of Ray Manning on 2 April 2014.
| Party | Candidate | Votes | % | ±% | |
|---|---|---|---|---|---|
| Conservative | Lynda Harford | 787 | 46.0 | +0.6 | |
| UKIP | Martin Hale | 251 | 14.7 | −7.3 | |
| Liberal Democrats | Fiona Whelan | 238 | 13.9 | +5.4 | |
| Labour | Alex Smith | 235 | 13.7 | +0.1 | |
| Green | Claudia Roland | 200 | 11.7 | +2.3 | |
| Majority | 536 | 31.3 | |||
| Turnout | 1,711 | 23.6 | |||
| Conservative hold | Swing | ||||
By-election held following the death of John Reynolds.
| Party | Candidate | Votes | % | ±% | |
|---|---|---|---|---|---|
| Conservative | Chris Boden | 2,237 | 56.2 | +0.6 | |
| UKIP | Paul Edwards | 1,131 | 28.4 | −1.1 | |
| Liberal Democrats | David Chapman | 615 | 15.4 | +15.4 | |
| Majority | 1,106 | 27.8 | |||
| Turnout | 3,983 | 65.5 | |||
| Conservative hold | Swing | ||||
By-election following resignation of Martin Curtis on 22 March 2015.
| Party | Candidate | Votes | % | ±% | |
|---|---|---|---|---|---|
| Conservative | Samantha Hoy | 1,020 | 63.8 | +32.4 | |
| UKIP | Susan Carson | 298 | 18.6 | −19.6 | |
| Labour | Dean Reeves | 219 | 13.7 | −2.7 | |
| Liberal Democrats | Josie Ratcliffe | 61 | 3.8 | −10.1 | |
| Majority | 722 | 45.2 | |||
| Turnout | 1,908 | 20.0 | |||
| Conservative gain from UKIP | Swing | ||||
The by-election was triggered by the resignation of Councillor Peter Lagoda, who was elected for the UK Independence Party, following his conviction for benefit fraud.[34]
| Party | Candidate | Votes | % | ±% | |
|---|---|---|---|---|---|
| Labour | Zoe Moghadas | 829 | 37.3 | +5.6 | |
| Liberal Democrats | Nichola Martin | 782 | 35.2 | −12.7 | |
| Green | Debbie Aitchison | 467 | 21.0 | +15.1 | |
| Conservative | Raja Rahatul | 100 | 4.5 | +0.1 | |
| UKIP | Richard Jeffs | 46 | 2.1 | −3.0 | |
| Majority | 47 | 2.1 | |||
| Turnout | 2,224 | 32.5 | |||
| Labour gain from Liberal Democrats | Swing | ||||
By-election following the resignation of Killian Bourke on 11 May 2015.
| Party | Candidate | Votes | % | ±% | |
|---|---|---|---|---|---|
| UKIP | Richard Mandley | 600 | 41.0 | +6.2 | |
| Conservative | Alan Melton | 590 | 40.3 | +5.8 | |
| Liberal Democrats | John Freeman | 274 | 18.7 | −2.6 | |
| Majority | 10 | 0.7 | |||
| Turnout | 1,464 | 23.5 | |||
| UKIP hold | Swing | ||||
By-election following the death of Sandra Rylance.
| Party | Candidate | Votes | % | ±% | |
|---|---|---|---|---|---|
| Liberal Democrats | Lorna Dupré | 1,063 | 52.5 | +19.8 | |
| Conservative | Mike Bradley | 651 | 32.2 | −17.2 | |
| UKIP | Pete Bigsby | 208 | 10.3 | +10.3 | |
| Independent | Owen Winters | 102 | 5.0 | +5.0 | |
| Majority | 412 | 20.3 | |||
| Turnout | 2,044 | 31.6 | |||
| Liberal Democrats gain from Conservative | Swing | ||||
The by-election was triggered by the death of Councillor Phil Read, who was elected as a Conservative.[38]
| Party | Candidate | Votes | % | ±% | |
|---|---|---|---|---|---|
| Independent | Simone Taylor | 1,104 | 34.2 | ||
| Conservative | Karl Wainwright | 1,024 | 31.7 | ||
| Labour | Nik Johnson | 625 | 19.3 | ||
| Independent | James Corley | 479 | 14.8 | ||
| Majority | 80 | 2.5 | |||
| Turnout | 3,232 | 27.0 | |||
| Independent hold | Swing | ||||
By-election following the death of Councillor Steven Van de Kerkhove in January 2016. 2-member division.
| Party | Candidate | Votes | % | ±% | |
|---|---|---|---|---|---|
| Conservative | Mark Goldsack | 858 | 48.8 | −17.4 | |
| Liberal Democrats | Victoria Charlesworth | 527 | 30.0 | +12.5 | |
| Labour | Lee Jinks | 191 | 10.9 | −5.5 | |
| Independent | Geoffrey Woollard | 182 | 10.4 | +10.4 | |
| Majority | 331 | 18.8 | −30.0 | ||
| Turnout | 1,772 | 21.2 | −5.7 | ||
| Conservative hold | Swing | −15.0 | |||
| Party | Candidate | Votes | % | ±% | |
|---|---|---|---|---|---|
| Liberal Democrats | Barbara Ashwood | 1,328 | 46.7 | +7.7 | |
| Labour | Rob Grayston | 741 | 26.0 | −3.6 | |
| Conservative | Shapour Meftah | 452 | 15.9 | −8.4 | |
| Green | Beverley Carpenter | 325 | 11.4 | +4.3 | |
| Majority | 587 | 20.6 | +11.2 | ||
| Turnout | 2,883 | 37.0 | −7.3 | ||
| Liberal Democrats hold | Swing | +5.6 | |||
| Party | Candidate | Votes | % | ±% | |
|---|---|---|---|---|---|
| Liberal Democrats | Peter McDonald | 1,607 | 59.6 | +26.3 | |
| Conservative | Stephen Edwards | 1,090 | 40.4 | −14.7 | |
| Majority | 517 | 19.2 | −2.7 | ||
| Turnout | 2,711 | 32.5 | −13.7 | ||
| Liberal Democrats gain from Conservative | Swing | +20.5 | |||
| Party | Candidate | Votes | % | ±% | |
|---|---|---|---|---|---|
| Liberal Democrats | Geoffrey Seeff | 1,042 | 43.5 | +43.5 | |
| Conservative | Andrew Jennings | 746 | 31.1 | −5.3 | |
| Independent | Colin Maslen | 360 | 15.0 | +15.0 | |
| Labour | Taylor Purdon | 250 | 10.4 | −2.5 | |
| Majority | 296 | 12.3 | |||
| Turnout | 2,398 | ||||
| Liberal Democrats gain from St Neots Independents | Swing | ||||
| Party | Candidate | Votes | % | ±% | |
|---|---|---|---|---|---|
| Labour | Mike Black | 1,174 | 43.0 | –5.2 | |
| Conservative | Robert Boorman | 761 | 27.9 | +11.1 | |
| Green | Stephen Lawrence | 397 | 14.6 | +1.2 | |
| Liberal Democrats | Sam Oliver | 396 | 14.5 | –7.2 | |
| Majority | 413 | 15.1 | |||
| Turnout | 2,728 | ||||
| Labour hold | Swing | ||||
| Party | Candidate | Votes | % | ±% | |
|---|---|---|---|---|---|
| Conservative | Bill Hunt | 1,568 | 44.6 | -6.9 | |
| Liberal Democrats | Connor Docwra | 1,276 | 36.3 | +12.8 | |
| Labour | Simon Patenall | 379 | 10.8 | -6.8 | |
| Green | Pip Gardner | 293 | 8.3 | +0.8 | |
| Majority | 292 | 8.3 | |||
| Turnout | 3,567 | ||||
| Conservative hold | Swing | ||||