County in Georgia, United States
County in Georgia
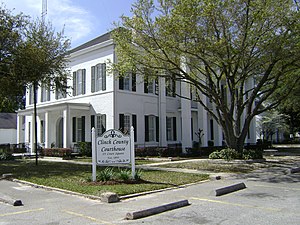
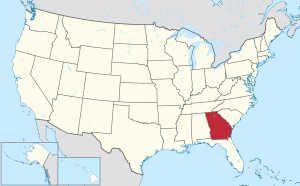
Clinch County is a county located in the southeastern part of the U.S. state of Georgia. As of the 2020 census, the population was 6,749.[1] The county seat is Homerville.[2] The county was created on February 14, 1850, named in honor of Duncan Lamont Clinch.[3]
Geography
According to the U.S. Census Bureau, the county has a total area of 824 square miles (2,130 km2), of which 800 square miles (2,100 km2) is land and 24 square miles (62 km2) (2.9%) is water.[4] It is the fourth-largest county in Georgia by land area and third-largest by total area. Eastern and southeastern portions of the county lie within the Okefenokee Swamp and its federally protected areas.
The vast majority of Clinch County is located in the Upper Suwannee River sub-basin of the Suwannee River basin, with just a portion of the western and northwestern edge of the county, southwest and well northwest of Du Pont, located in the Alapaha River sub-basin of the same Suwannee River basin.[5]
Major highways
Adjacent counties
National protected area
Communities
Cities
Towns
Demographics
Historical population
| Census | Pop. | Note | %± |
|---|
| 1850 | 637 | | — |
|---|
| 1860 | 3,063 | | 380.8% |
|---|
| 1870 | 3,945 | | 28.8% |
|---|
| 1880 | 4,138 | | 4.9% |
|---|
| 1890 | 6,652 | | 60.8% |
|---|
| 1900 | 8,732 | | 31.3% |
|---|
| 1910 | 8,424 | | −3.5% |
|---|
| 1920 | 7,984 | | −5.2% |
|---|
| 1930 | 7,015 | | −12.1% |
|---|
| 1940 | 6,437 | | −8.2% |
|---|
| 1950 | 6,007 | | −6.7% |
|---|
| 1960 | 6,545 | | 9.0% |
|---|
| 1970 | 6,405 | | −2.1% |
|---|
| 1980 | 6,660 | | 4.0% |
|---|
| 1990 | 6,160 | | −7.5% |
|---|
| 2000 | 6,878 | | 11.7% |
|---|
| 2010 | 6,798 | | −1.2% |
|---|
| 2020 | 6,749 | | −0.7% |
|---|
|
Clinch County, Georgia – Racial and ethnic composition
(NH = Non-Hispanic)
Note: the US Census treats Hispanic/Latino as an ethnic category. This table excludes Latinos from the racial categories and assigns them to a separate category. Hispanics/Latinos may be of any race.
| Race / Ethnicity
|
Pop 2000[16]
|
Pop 2010[14]
|
Pop 2020[15]
|
% 2000
|
% 2010
|
% 2020
|
| White alone (NH)
|
4,713
|
4,536
|
4,256
|
68.52%
|
66.73%
|
63.06%
|
| Black or African American alone (NH)
|
2,019
|
1,876
|
1,950
|
29.35%
|
27.60%
|
28.89%
|
| Native American or Alaska Native alone (NH)
|
27
|
38
|
30
|
0.39%
|
0.56%
|
0.44%
|
| Asian alone (NH)
|
8
|
13
|
22
|
0.12%
|
0.19%
|
0.33%
|
| Pacific Islander alone (NH)
|
0
|
4
|
7
|
0.00%
|
0.06%
|
0.10%
|
| Other race alone (NH)
|
3
|
16
|
31
|
0.04%
|
0.24%
|
0.46%
|
| Mixed race or Multiracial (NH)
|
54
|
79
|
200
|
0.79%
|
1.16%
|
2.96%
|
| Hispanic or Latino (any race)
|
54
|
236
|
253
|
0.79%
|
3.47%
|
3.75%
|
| Total
|
6,878
|
6,798
|
6,749
|
100.00%
|
100.00%
|
100.00%
|
As of the 2020 United States census, there were 6,749 people, 2,477 households, and 1,639 families residing in the county.


