Borough result maps
-
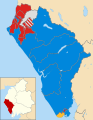 2003 results map
 -
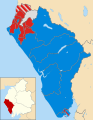
 2007 results map
 -
 2011 results map
 -
 2015 results map
Copeland Borough Council in Cumbria, England was elected every four years.
The council was established in 1974 and abolished in 2023.
Since the foundation of the council in 1973 political control of the council has been held by the following parties:[1]
| Party in control | Years | |
|---|---|---|
| Labour | 1973–1976 | |
| No overall control | 1976–1979 | |
| Labour | 1979–2023 | |
Prior to 2015, political leadership was provided by the leader of the council. The leader from 2003 to 2015 was:[2]
| Councillor | Party | From | To | |
|---|---|---|---|---|
| Elaine Woodburn | Labour | 2003 | 10 May 2015 | |
In 2015 the council changed to having directly-elected mayors. The mayor from 2015 until the council's abolition in 2023 was Mike Starkie, who was elected in 2015 and 2019 as an independent, but subsequently joined the Conservatives in June 2020.[3]
| Mayor | Party | From | To | |
|---|---|---|---|---|
| Mike Starkie | Independent | 11 May 2015 | 22 Jun 2020 | |
| Conservative | 22 Jun 2020 | 31 Mar 2023 | ||


| Party | Candidate | Votes | % | ±% | |
|---|---|---|---|---|---|
| Conservative | 1,113 | 52.1 | +13.3 | ||
| Labour | 1,025 | 47.9 | -13.3 | ||
| Majority | 88 | 4.2 | |||
| Turnout | 2,138 | ||||
| Conservative gain from Labour | Swing | ||||
| Party | Candidate | Votes | % | ±% | |
|---|---|---|---|---|---|
| Labour | 470 | 68.1 | -7.3 | ||
| Conservative | 164 | 23.9 | -0.7 | ||
| Liberal Democrats | 55 | 8.0 | +8.0 | ||
| Majority | 305 | 44.2 | |||
| Turnout | 690 | ||||
| Labour hold | Swing | ||||
| Party | Candidate | Votes | % | ±% | |
|---|---|---|---|---|---|
| Labour | 442 | 58.0 | +4.5 | ||
| Conservative | 320 | 42.0 | +20.8 | ||
| Majority | 122 | 16.0 | |||
| Turnout | 762 | ||||
| Labour hold | Swing | ||||
| Party | Candidate | Votes | % | ±% | |
|---|---|---|---|---|---|
| Conservative | 230 | 64.4 | +11.4 | ||
| Labour | 91 | 25.6 | -21.2 | ||
| Liberal Democrats | 35 | 9.8 | +9.8 | ||
| Majority | 139 | 38.8 | |||
| Turnout | 356 | ||||
| Conservative hold | Swing | ||||
| Party | Candidate | Votes | % | ±% | |
|---|---|---|---|---|---|
| Labour | 229 | 73.2 | -13.9 | ||
| Conservative | 84 | 26.8 | +13.9 | ||
| Majority | 145 | 46.4 | |||
| Turnout | 313 | ||||
| Labour hold | Swing | ||||
| Party | Candidate | Votes | % | ±% | |
|---|---|---|---|---|---|
| Conservative | 597 | 51.8 | +7.2 | ||
| Liberal Democrats | 376 | 32.6 | +32.6 | ||
| Labour | 180 | 15.6 | -25.3 | ||
| Majority | 221 | 19.2 | |||
| Turnout | 1,153 | 40.8 | |||
| Conservative hold | Swing | ||||
| Party | Candidate | Votes | % | ±% | |
|---|---|---|---|---|---|
| Conservative | 407 | 57.4 | |||
| Labour | 302 | 42.6 | |||
| Majority | 105 | 14.8 | |||
| Turnout | 709 | 31.0 | |||
| Conservative gain from Labour | Swing | ||||
| Party | Candidate | Votes | % | ±% | |
|---|---|---|---|---|---|
| Labour | 817 | 79.7 | +2.6 | ||
| Conservative | 208 | 20.3 | +20.3 | ||
| Majority | 609 | 59.4 | |||
| Turnout | 1,025 | 29.5 | |||
| Labour hold | Swing | ||||
| Party | Candidate | Votes | % | ±% | |
|---|---|---|---|---|---|
| Labour | Anne Bradshaw | 480 | 41.0 | -21.6 | |
| Conservative | Richard Maley | 387 | 33.0 | -4.4 | |
| Liberal Democrats | Francis Hollowell | 304 | 26.0 | +26.0 | |
| Majority | 93 | 8.0 | |||
| Turnout | 1,171 | 37.0 | |||
| Labour hold | Swing | ||||
| Party | Candidate | Votes | % | ±% | |
|---|---|---|---|---|---|
| Labour | Hugh Branney | 307 | 61.6 | +15.0 | |
| Independent | Lauren Mossop | 191 | 38.4 | -15.0 | |
| Majority | 116 | 23.2 | |||
| Turnout | 498 | 15.4 | |||
| Labour gain from Independent | Swing | ||||
| Party | Candidate | Votes | % | ±% | |
|---|---|---|---|---|---|
| Conservative | Alan Jacob | 264 | 64.2 | -7.7 | |
| Labour | Christine Cornall | 85 | 20.7 | -7.4 | |
| Liberal Democrats | Mike Minogue | 62 | 15.1 | +15.1 | |
| Majority | 179 | 43.5 | |||
| Turnout | 411 | 34.9 | |||
| Conservative hold | Swing | ||||
| Party | Candidate | Votes | % | ±% | |
|---|---|---|---|---|---|
| Labour | Geoffrey Garrity | 385 | 61.1 | -10.6 | |
| Conservative | Alexander Carroll | 207 | 32.9 | +4.6 | |
| Liberal Democrats | Frank Hollowell | 38 | 6.0 | +6.0 | |
| Majority | 178 | 28.2 | |||
| Turnout | 630 | 19.8 | |||
| Labour hold | Swing | ||||
| Party | Candidate | Votes | % | ±% | |
|---|---|---|---|---|---|
| Labour | Jeanette Williams | 463 | 44.3 | -17.1 | |
| Conservative | Brigid Whiteside | 337 | 32.2 | -6.4 | |
| BNP | Bill Pugh | 245 | 23.4 | +23.4 | |
| Majority | 126 | 12.1 | |||
| Turnout | 1,045 | 31.5 | |||
| Labour hold | Swing | ||||
| Party | Candidate | Votes | % | ±% | |
|---|---|---|---|---|---|
| Labour | Allan Forster | 670 | 75.0 | +4.3 | |
| Conservative | Genna Martin | 223 | 25.0 | -4.3 | |
| Majority | 447 | 50.1 | |||
| Turnout | 28.3 | ||||
| Labour hold | Swing | ||||
| Party | Candidate | Votes | % | ±% | |
|---|---|---|---|---|---|
| Conservative | Gerard James McGrath | 954 | 61.4 | -9.6 | |
| Labour | Angela Dixon | 601 | 38.6 | +16.4 | |
| Majority | 353 | 22.7 | |||
| Turnout | 1,555 | 59.7 | |||
| Conservative hold | Swing | ||||
| Party | Candidate | Votes | % | ±% | |
|---|---|---|---|---|---|
| Labour | Tom Higgins | 354 | 52.4 | +15.7 | |
| Conservative | Jeff Hailes | 321 | 47.6 | +26.8 | |
| Majority | 33 | 4.9 | |||
| Turnout | 675 | 23.8 | |||
| Labour hold | Swing | ||||
| Party | Candidate | Votes | % | ±% | |
|---|---|---|---|---|---|
| Labour | Joseph Ghayouba | 633 | 47.7 | +13.5 | |
| Conservative | William R. C. S. Dixon | 542 | 40.8 | +13.0 | |
| Independent | Richard Donnan | 90 | 6.8 | +6.8 | |
| Heritage | William R. Dixon | 45 | 3.4 | +3.4 | |
| Liberal Democrats | Mike Minogue | 18 | 1.4 | +1.4 | |
| Majority | 91 | 6.9 | |||
| Turnout | 1,328 | ||||
| Labour hold | Swing | ||||