County result maps
-
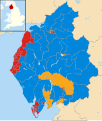 2001 results map
 -
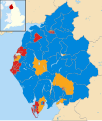 2005 results map
 -
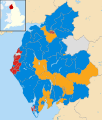 2009 results map
 -
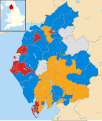 2013 results map
 -
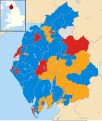 2017 results map
Cumbria County Council in England was elected every four years between 1973 and 2017. Since the last boundary changes in 2013, 84 councillors were elected from 84 wards for the last council before abolition in 2023.[1]
Political control of the council from 1974 until its abolition in 2023 was held by the following parties:[2]
| Party in control | Years | |
|---|---|---|
| No overall control | 1974–1977 | |
| Conservative | 1977–1981 | |
| Labour | 1981–1985 | |
| No overall control | 1985–1997 | |
| Labour | 1997–2001 | |
| No overall control | 2001–2023 | |
The leaders of the council from 1986 until its abolition in 2023 were:[3]
| Councillor | Party | From | To | |
|---|---|---|---|---|
| Bill Minto[4] | Labour | 1986 | 9 May 2000 | |
| Stewart Young | Labour | 9 May 2000 | 21 Jun 2001 | |
| Rex Toft[5] | Conservative | 21 Jun 2001 | 16 Sep 2004 | |
| Tim Stoddard | Conservative | 16 Sep 2004 | 10 Sep 2008 | |
| Stewart Young | Labour | 10 Sep 2008 | 18 Jun 2009 | |
| Jim Buchanan[6] | Conservative | 18 Jun 2009 | 8 Apr 2010 | |
| Eddie Martin | Conservative | 22 Apr 2010 | 5 May 2013 | |
| Stewart Young | Labour | 16 May 2013 | 31 Mar 2023 | |
| Overall control | Conservative | Labour | Lib Dems[a] | Socialist People's | Liberal | Independent | |||||||
| 2017 | NOC | 37 | 26 | 16 | - | - | 5 | ||||||
| 2013 | NOC | 26 | 35 | 16 | - | - | 7 | ||||||
| 2009 | NOC | 38 | 24 | 16 | 1 | - | 5 | ||||||
| 2005 | NOC | 32 | 39 | 11 | - | - | 2 | ||||||
| 2001 | NOC | 33 | 40 | 10 | - | - | 1 | ||||||
| 2001 | NOC | 33 | 40 | 10 | - | - | 1 | ||||||
| 1997 | Labour | 22 | 44 | 13 | - | - | 4 | ||||||
| 1993 | NOC | 28 | 39 | 13 | - | 1 | 2 | ||||||
| 1989 | NOC | 37 | 37 | 6 | - | - | 3 | ||||||
| 1985 | NOC | 36 | 39 | 5 | - | - | 3 | ||||||
| 1981 | NOC | 35 | 42 | 3 | - | - | 3 | ||||||
| 1977 | Conservative | 52 | 23 | - | - | - | 7 | ||||||
| 1973 | NOC | 31 | 38 | 1 | - | - | 12 | ||||||


| Party | Candidate | Votes | % | ±% | |
|---|---|---|---|---|---|
| Conservative | 616 | 41.0 | |||
| Liberal Democrats | 510 | 34.0 | |||
| Labour | 317 | 21.0 | |||
| Independent | 51 | 3.4 | |||
| Majority | 106 | 7.0 | |||
| Turnout | 1,494 | 25.0 | |||
| Conservative hold | Swing | ||||
| Party | Candidate | Votes | % | ±% | |
|---|---|---|---|---|---|
| Liberal Democrats | 908 | 62.6 | +11.8 | ||
| Conservative | 328 | 22.6 | -5.4 | ||
| Labour | 214 | 14.8 | -6.4 | ||
| Majority | 580 | 40.0 | |||
| Turnout | 1,450 | ||||
| Liberal Democrats hold | Swing | ||||
| Party | Candidate | Votes | % | ±% | |
|---|---|---|---|---|---|
| Conservative | 660 | 82.9 | +18.2 | ||
| Labour | 136 | 17.1 | -18.2 | ||
| Majority | 524 | 65.8 | |||
| Turnout | 796 | 17.9 | |||
| Conservative hold | Swing | ||||
| Party | Candidate | Votes | % | ±% | |
|---|---|---|---|---|---|
| Liberal Democrats | 930 | 55.7 | -0.1 | ||
| Conservative | 558 | 33.4 | -0.3 | ||
| Labour | 182 | 10.9 | +0.4 | ||
| Majority | 372 | 22.3 | |||
| Turnout | 1,670 | ||||
| Liberal Democrats hold | Swing | ||||
| Party | Candidate | Votes | % | ±% | |
|---|---|---|---|---|---|
| Labour | 332 | 45.0 | -31.4 | ||
| Independent | 255 | 34.6 | +34.6 | ||
| Conservative | 151 | 20.5 | -3.1 | ||
| Majority | 77 | 10.4 | |||
| Turnout | 738 | 20.5 | |||
| Labour hold | Swing | ||||
| Party | Candidate | Votes | % | ±% | |
|---|---|---|---|---|---|
| Conservative | 346 | 37.4 | +9.8 | ||
| Labour | 340 | 36.8 | -18.4 | ||
| Liberal Democrats | 238 | 25.8 | +8.2 | ||
| Majority | 6 | 0.6 | |||
| Turnout | 924 | ||||
| Conservative gain from Labour | Swing | ||||
| Party | Candidate | Votes | % | ±% | |
|---|---|---|---|---|---|
| Conservative | Isa Henderson | 797 | 41.8 | +6.3 | |
| Independent | Bryan Metz | 787 | 41.2 | +22.0 | |
| Labour | Christopher Bagshaw | 324 | 17.0 | +7.6 | |
| Majority | 10 | 0.6 | |||
| Turnout | 1,908 | 41.0 | |||
| Conservative hold | Swing | ||||
| Party | Candidate | Votes | % | ±% | |
|---|---|---|---|---|---|
| Conservative | 1,229 | 66.2 | +6.0 | ||
| Liberal Democrats | 556 | 30.0 | -9.8 | ||
| Labour | 71 | 3.8 | +3.8 | ||
| Majority | 673 | 36.2 | |||
| Turnout | 1,856 | 36.8 | |||
| Conservative hold | Swing | ||||
| Party | Candidate | Votes | % | ±% | |
|---|---|---|---|---|---|
| Liberal Democrats | 889 | 51.1 | +41.4 | ||
| Labour | 851 | 48.9 | -26.2 | ||
| Majority | 38 | 2.2 | |||
| Turnout | 1,740 | 44.4 | |||
| Liberal Democrats gain from Labour | Swing | ||||
| Party | Candidate | Votes | % | ±% | |
|---|---|---|---|---|---|
| Labour | 645 | 57.5 | -25.5 | ||
| Liberal Democrats | 476 | 42.5 | +42.5 | ||
| Majority | 169 | 15.0 | |||
| Turnout | 1,121 | 22.0 | |||
| Labour hold | Swing | ||||
| Party | Candidate | Votes | % | ±% | |
|---|---|---|---|---|---|
| Independent | 273 | 62.8 | +62.8 | ||
| Labour | 162 | 37.2 | -17.2 | ||
| Majority | 111 | 25.6 | |||
| Turnout | 435 | 13.3 | |||
| Independent gain from Labour | Swing | ||||
| Party | Candidate | Votes | % | ±% | |
|---|---|---|---|---|---|
| Labour | Joseph Holliday | 658 | 53.3 | -4.5 | |
| Conservative | John Heathcote | 430 | 34.8 | -7.4 | |
| Independent | John Bracken | 120 | 9.7 | +9.7 | |
| Green | Lynn Bates | 26 | 2.1 | +2.1 | |
| Majority | 228 | 18.5 | |||
| Turnout | 1,234 | 32.3 | |||
| Labour hold | Swing | ||||
| Party | Candidate | Votes | % | ±% | |
|---|---|---|---|---|---|
| Conservative | Lawrence Fisher | 717 | 61.4 | +13.6 | |
| Labour | Alex Faulds | 363 | 31.1 | +2.9 | |
| BNP | David Fisher | 88 | 7.5 | +7.5 | |
| Majority | 354 | 30.3 | |||
| Turnout | 1,168 | 23.3 | |||
| Conservative hold | Swing | ||||
| Party | Candidate | Votes | % | ±% | |
|---|---|---|---|---|---|
| Liberal Democrats | Olwyn Lockley | 653 | 64.0 | +20.2 | |
| Labour | Joseph Hendry | 222 | 21.7 | -18.2 | |
| Conservative | James Bainbridge | 117 | 11.5 | -4.8 | |
| Green | Lynn Bates | 29 | 2.8 | +2.8 | |
| Majority | 431 | 42.3 | |||
| Turnout | 1,021 | 25.2 | |||
| Liberal Democrats hold | Swing | ||||
| Party | Candidate | Votes | % | ±% | |
|---|---|---|---|---|---|
| Liberal Democrats | Patricia Bell | 800 | 59.8 | +14.7 | |
| Conservative | Dawn Dixon | 380 | 28.4 | -2.2 | |
| Independent | Keith Phillips | 123 | 9.2 | +3.6 | |
| Green | Alan Marsden | 34 | 2.5 | +2.5 | |
| Majority | 420 | 31.4 | |||
| Turnout | 1,337 | 29.7 | |||
| Liberal Democrats hold | Swing | ||||
| Party | Candidate | Votes | % | ±% | |
|---|---|---|---|---|---|
| Labour | Wendy Skillicorn | 434 | 41.7 | -24.1 | |
| BNP | Simon Nicholson | 418 | 40.1 | +40.1 | |
| Conservative | Brigid Anne Whiteside | 190 | 18.2 | +1.1 | |
| Majority | 16 | 1.5 | -47.1 | ||
| Turnout | 1,042 | 26.6 | -26.7 | ||
| Labour hold | Swing | ||||
| Party | Candidate | Votes | % | ±% | |
|---|---|---|---|---|---|
| Conservative | Val Tarbitt | 1,718 | 48.4 | -13.8 | |
| Liberal Democrats | Ian Highmore | 1,158 | 32.7 | +32.7 | |
| Labour | Helen Horne | 495 | 14.0 | -8.9 | |
| BNP | Tony Carvell | 175 | 4.9 | -10.0 | |
| Majority | 560 | 15.8 | |||
| Turnout | 3,546 | ||||
| Conservative hold | Swing | ||||
| Party | Candidate | Votes | % | ±% | |
|---|---|---|---|---|---|
| Conservative | Mike Johnson | 823 | 70.6 | +13.8 | |
| Green | Helen Graham | 342 | 29.4 | +29.4 | |
| Majority | 481 | 41.3 | |||
| Turnout | 1,165 | ||||
| Conservative hold | Swing | ||||
| Party | Candidate | Votes | % | ±% | |
|---|---|---|---|---|---|
| Conservative | Ronald Munby | 827 | 32.3 | +0.7 | |
| Independent | David Robinson | 650 | 25.4 | +25.4 | |
| Liberal Democrats | Martin Pugmire | 619 | 24.2 | -17.8 | |
| Labour | Brian Cope | 464 | 18.1 | +2.9 | |
| Majority | 177 | 6.9 | |||
| Turnout | 2,560 | ||||
| Conservative gain from Liberal Democrats | Swing | ||||
| Party | Candidate | Votes | % | ±% | |
|---|---|---|---|---|---|
| Labour | Willie Whalen | 407 | 40.9 | +16.9 | |
| Liberal Democrats | Olwyn Luckley | 369 | 37.1 | +2.8 | |
| Conservative | Keith Meller | 93 | 9.3 | -10.2 | |
| UKIP | Michael Owen | 72 | 7.2 | +7.2 | |
| Green | Neil Boothman | 54 | 5.4 | +5.4 | |
| Majority | 38 | 3.8 | |||
| Turnout | 995 | ||||
| Labour gain from Liberal Democrats | Swing | ||||
| Party | Candidate | Votes | % | ±% | |
|---|---|---|---|---|---|
| Liberal Democrats | John McCreesh | 1,157 | 55.7 | -16.5 | |
| Labour | Paul Braithwaite | 542 | 26.1 | +18.9 | |
| Conservative | Patrick Birchall | 268 | 12.9 | -4.5 | |
| UKIP | Malcolm Nightingale | 110 | 5.3 | +5.3 | |
| Majority | 615 | 29.6 | |||
| Turnout | 2,077 | ||||
| Liberal Democrats hold | Swing | ||||
| Party | Candidate | Votes | % | ±% | |
|---|---|---|---|---|---|
| Conservative | Jim Lister | 625 | 34.7 | -22.1 | |
| Labour | Brian Cope | 520 | 28.9 | +4.1 | |
| Independent | Bill Finlay | 390 | 21.7 | +21.7 | |
| Liberal Democrats | Phill Roberts | 206 | 11.5 | -6.9 | |
| Green | David Bober | 58 | 3.2 | +3.2 | |
| Majority | 105 | 5.8 | |||
| Turnout | 1,799 | ||||
| Conservative hold | Swing | ||||
| Party | Candidate | Votes | % | ±% | |
|---|---|---|---|---|---|
| Labour | Celia Tibble | 628 | 46.8 | +14.8 | |
| UKIP | Robert Hardon | 483 | 36.0 | +10.9 | |
| Conservative | Mike Davidson | 107 | 8.0 | +3.3 | |
| Independent | Tony North | 98 | 7.3 | +7.3 | |
| Liberal Democrats | Frank Hollowell | 26 | 1.9 | +1.9 | |
| Majority | 145 | 10.8 | |||
| Turnout | 1,342 | ||||
| Labour gain from Independent | Swing | ||||
| Party | Candidate | Votes | % | ±% | |
|---|---|---|---|---|---|
| Labour | Christine Bowditch | 565 | 45.8 | -20.1 | |
| Conservative | Nigel Christian | 435 | 35.3 | +1.2 | |
| UKIP | John Stayner | 234 | 19.0 | +19.0 | |
| Majority | 130 | 10.5 | |||
| Turnout | 1,234 | ||||
| Labour hold | Swing | ||||
| Party | Candidate | Votes | % | ±% | |
|---|---|---|---|---|---|
| Labour | Alan McGuckin | 389 | 37.7 | -2.8 | |
| Conservative | James Bainbridge | 245 | 23.7 | +13.1 | |
| UKIP | John Stanyer | 235 | 22.8 | +2.8 | |
| Liberal Democrats | Lawrence Jennings | 112 | 10.9 | -12.3 | |
| Green | Neil Boothman | 51 | 4.9 | +0.9 | |
| Majority | 144 | 14.0 | |||
| Turnout | 1,032 | ||||
| Labour hold | Swing | ||||
| Party | Candidate | Votes | % | ±% | |
|---|---|---|---|---|---|
| Liberal Democrats | Colin Jones | 1,061 | 51.6 | -10.5 | |
| Conservative | James Bainbridge | 810 | 39.4 | +20.7 | |
| Independent | Robert Judson | 123 | 6.0 | +6.0 | |
| Green | Gwen Harrison | 61 | 3.0 | +3.0 | |
| Majority | 251 | 12.2 | |||
| Turnout | 2,055 | ||||
| Liberal Democrats hold | Swing | ||||
| Party | Candidate | Votes | % | ±% | |
|---|---|---|---|---|---|
| Labour | Frank Cassidy | 727 | 63.4 | +2.0 | |
| UKIP | Graham Pritchard | 239 | 20.8 | +3.3 | |
| Conservative | Greg Peers | 181 | 15.8 | -5.3 | |
| Majority | 488 | 42.5 | |||
| Turnout | 1,147 | ||||
| Labour hold | Swing | ||||
| Party | Candidate | Votes | % | ±% | |
|---|---|---|---|---|---|
| Liberal Democrats | Sue Sanderson | 1,394 | 46.1 | -21.7 | |
| Conservative | Greg Peers | 1,355 | 44.8 | +12.6 | |
| Green | Gwen Harrison | 276 | 9.1 | +9.1 | |
| Majority | 39 | 1.3 | |||
| Turnout | 3,025 | ||||
| Liberal Democrats hold | Swing | ||||
| Party | Candidate | Votes | % | ±% | |
|---|---|---|---|---|---|
| Conservative | Thomas Wentworth Waites | 635 | 55.1 | +2.2 | |
| Liberal Democrats | Judith Derbyshire | 518 | 44.9 | +22.1 | |
| Majority | 117 | 10.1 | |||
| Turnout | 1,153 | ||||
| Conservative hold | Swing | ||||
| Party | Candidate | Votes | % | ±% | |
|---|---|---|---|---|---|
| Labour | Gillian Troughton | 435 | 47.5 | -13.0 | |
| Conservative | Andrew Wonnacott | 304 | 33.2 | +2.3 | |
| UKIP | Eric Atkinson | 176 | 19.2 | +19.2 | |
| Majority | 131 | 14.3 | |||
| Turnout | 915 | ||||
| Labour hold | Swing | ||||
| Party | Candidate | Votes | % | ±% | |
|---|---|---|---|---|---|
| Liberal Democrats | Peter Thornton | 1,067 | 59.9 | +7.7 | |
| Labour | Gillian Troughton | 307 | 17.2 | -9.7 | |
| Conservative | Harry Taylor | 172 | 9.7 | -0.5 | |
| Green | Andy Mason | 128 | 7.2 | +7.2 | |
| UKIP | David Walker | 106 | 6.0 | -3.9 | |
| Majority | 760 | 42.7 | |||
| Turnout | 1,780 | ||||
| Liberal Democrats hold | Swing | ||||
| Party | Candidate | Votes | % | ±% | |
|---|---|---|---|---|---|
| Liberal Democrats | Steve Rooke | 1,009 | 52.3 | +0.7 | |
| Conservative | Ben Berry | 785 | 40.7 | +1.3 | |
| Labour | Penny Henderson | 88 | 4.6 | +4.6 | |
| Green | Kate Threadgold | 46 | 2.4 | -0.6 | |
| Majority | 224 | 11.6 | |||
| Turnout | 1,928 | ||||
| Liberal Democrats hold | Swing | ||||
| Party | Candidate | Votes | % | ±% | |
|---|---|---|---|---|---|
| Labour | Karen Lockney | 625 | 59.1 | -0.9 | |
| Conservative | Geoffrey Osborne | 292 | 27.6 | +0.6 | |
| Green | Helen Davison | 94 | 8.9 | +1.9 | |
| UKIP | Phil Douglass | 46 | 4.4 | -1.6 | |
| Majority | 333 | 31.5 | |||
| Turnout | 1,057 | ||||
| Labour hold | Swing | ||||
| Party | Candidate | Votes | % | ±% | |
|---|---|---|---|---|---|
| Liberal Democrats | Phil Douglass | 1,381 | 62.0 | +9.0 | |
| Conservative | Tom Harvey | 666 | 29.9 | -7.2 | |
| Green | Jill Abel | 109 | 4.9 | -1.1 | |
| Labour | Kate Love | 70 | 3.1 | -0.7 | |
| Majority | 715 | 32.1 | |||
| Turnout | 2,226 | ||||
| Liberal Democrats hold | Swing | ||||
| Party | Candidate | Votes | % | ±% | |
|---|---|---|---|---|---|
| Conservative | Tom Harvey | N/A | N/A | N/A | |
| Majority | N/A | N/A | |||
| Turnout | N/A | ||||
| Conservative hold | Swing | ||||
| Party | Candidate | Votes | % | ±% | |
|---|---|---|---|---|---|
| Conservative | Mike Mitchelson | 933 | 56.2 | +0.7 | |
| Liberal Democrats | Roger Dobson | 272 | 16.4 | +7.7 | |
| Labour | Chris Wills | 246 | 14.8 | -5.9 | |
| Green | Joanne Bates | 208 | 12.5 | +4.4 | |
| Majority | 661 | 39.8 | |||
| Turnout | 1,659 | ||||
| Conservative hold | Swing | ||||
| Party | Candidate | Votes | % | ±% | |
|---|---|---|---|---|---|
| Conservative | Catherine Bell | 807 | 41.3 | +11.4 | |
| Labour | Alan Smith | 546 | 28.0 | +1.2 | |
| Liberal Democrats | Fiona Jayatilaka | 411 | 21.0 | -18.8 | |
| Green | Jill Perry | 135 | 6.9 | +3.5 | |
| Independent | Nicky Cockburn | 54 | 2.8 | +2.8 | |
| Majority | 261 | 13.4 | |||
| Turnout | 1,953 | ||||
| Conservative gain from Liberal Democrats | Swing | ||||
| Party | Candidate | Votes | % | ±% | |
|---|---|---|---|---|---|
| Conservative | Debbie Garton | 621 | 36.8 | +15.8 | |
| Labour | Antony McGuckin | 603 | 35.7 | -0.4 | |
| Independent | Paul Scott | 368 | 21.8 | +21.8 | |
| Liberal Democrats | Margaret Bennett | 54 | 3.2 | +3.2 | |
| Green | Cathy Grout | 41 | 2.4 | -0.6 | |
| Majority | 18 | 1.1 | |||
| Turnout | 1,687 | ||||
| Conservative gain from Independent | Swing | ||||
| Party | Candidate | Votes | % | ±% | |
|---|---|---|---|---|---|
| Green | Judy Filmore | 885 | 39.6 | +32.4 | |
| Conservative | Andrew Butcher | 869 | 38.9 | -16.1 | |
| Labour | David Webster | 380 | 17.0 | -9.5 | |
| Liberal Democrats | Loraine Birchall | 102 | 4.6 | -6.7 | |
| Majority | 16 | 0.7 | |||
| Turnout | 2,236 | ||||
| Green gain from Conservative | Swing | ||||
| Party | Candidate | Votes | % | ±% | |
|---|---|---|---|---|---|
| Liberal Democrats | Roger Dobson | 857 | 71.0 | +60.8 | |
| Conservative | Tim Cheetham | 350 | 29.0 | -6.0 | |
| Majority | 507 | 42.0 | |||
| Turnout | 1,207 | ||||
| Liberal Democrats gain from Independent | Swing | ||||