Results maps
-
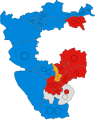 2019 results map
 -
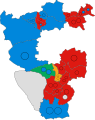 2023 results map
North East Derbyshire District Council elections are held every four years. North East Derbyshire District Council is the local authority for the non-metropolitan district of North East Derbyshire in Derbyshire, England. Since the last boundary changes in 2019, 53 councillors have been elected from 24 wards.[1]
| Year | Labour | Conservative | Liberal Democrats | Green | Independent | Control |
|---|---|---|---|---|---|---|
| 2003 | 36 | 8 | 5 | 0 | 4 | Labour |
| 2007 | 29 | 10 | 7 | 0 | 7 | Labour |
| 2011 | 34 | 17 | 0 | 0 | 2 | Labour |
| 2015 | 34 | 18 | 0 | 0 | 1 | Labour |
| 2019 | 18 | 30 | 3 | 0 | 2 | Conservative |
| 2023 | 28 | 19 | 3 | 1 | 2 | Labour |


| Party | Candidate | Votes | % | ±% | |
|---|---|---|---|---|---|
| Conservative | 444 | 51.7 | +11.1 | ||
| Labour | 415 | 48.3 | -11.1 | ||
| Majority | 29 | 3.4 | |||
| Turnout | 859 | 15.2 | |||
| Conservative gain from Labour | Swing | ||||
| Party | Candidate | Votes | % | ±% | |
|---|---|---|---|---|---|
| Conservative | 314 | 52.9 | +8.0 | ||
| Labour | 185 | 31.1 | -1.0 | ||
| Liberal Democrats | 95 | 16.0 | +16.0 | ||
| Majority | 129 | 21.8 | |||
| Turnout | 594 | ||||
| Conservative hold | Swing | ||||
| Party | Candidate | Votes | % | ±% | |
|---|---|---|---|---|---|
| Labour | 462 | 55.4 | -0.6 | ||
| Liberal Democrats | 221 | 26.5 | +6.5 | ||
| Conservative | 151 | 18.1 | -5.9 | ||
| Majority | 241 | 28.9 | |||
| Turnout | 834 | 23.0 | |||
| Labour hold | Swing | ||||
| Party | Candidate | Votes | % | ±% | |
|---|---|---|---|---|---|
| Liberal Democrats | Kevin Moore | 439 | 44.6 | +44.6 | |
| Conservative | 334 | 33.9 | -31.8 | ||
| Labour | 212 | 21.5 | -12.8 | ||
| Majority | 105 | 10.7 | |||
| Turnout | 985 | 33.3 | |||
| Liberal Democrats gain from Conservative | Swing | ||||
| Party | Candidate | Votes | % | ±% | |
|---|---|---|---|---|---|
| Labour | 547 | 65.0 | |||
| Liberal Democrats | Julie Hirst | 295 | 35.0 | ||
| Majority | 252 | 30.0 | |||
| Turnout | 842 | 32.0 | |||
| Labour hold | Swing | ||||
| Party | Candidate | Votes | % | ±% | |
|---|---|---|---|---|---|
| Liberal Democrats | Jan Robinson | 382 | 42.3 | ||
| Labour | Lee Stone | 356 | 39.4 | ||
| Conservative | Derek Jason | 165 | 18.3 | ||
| Majority | 26 | 2.9 | |||
| Turnout | 903 | 25.6 | |||
| Liberal Democrats gain from Labour | Swing | ||||
| Party | Candidate | Votes | % | ±% | |
|---|---|---|---|---|---|
| Labour | Billy Rice | 480 | 46.2 | ||
| Conservative | Gary Mason | 342 | 32.9 | ||
| Independent | Maureen Potts | 167 | 16.1 | ||
| Liberal Democrats | Terry Mcelligott | 51 | 4.9 | ||
| Majority | 138 | 13.3 | |||
| Turnout | 1,040 | 24.0 | |||
| Labour hold | Swing | ||||
| Party | Candidate | Votes | % | ±% | |
|---|---|---|---|---|---|
| Liberal Democrats | Gordon Austin | 169 | 31.2 | +31.2 | |
| Conservative | Bob Taylor | 160 | 29.6 | +29.6 | |
| Labour | David Hill | 146 | 27.0 | -13.0 | |
| Independent | Kenneth Perkins | 66 | 12.2 | -47.8 | |
| Majority | 9 | 1.6 | |||
| Turnout | 541 | 38.3 | |||
| Liberal Democrats gain from Independent | Swing | ||||
| Party | Candidate | Votes | % | ±% | |
|---|---|---|---|---|---|
| Labour | Lee Stone | 373 | 64.1 | ||
| Conservative | Derek Jason | 209 | 35.9 | ||
| Majority | 164 | 28.2 | |||
| Turnout | 582 | 21.5 | |||
| Labour gain from Liberal Democrats | Swing | ||||
| Party | Candidate | Votes | % | ±% | |
|---|---|---|---|---|---|
| Labour | Dick Marriot | 459 | 48.9 | -10.3 | |
| Conservative | Josh Broadhurst | 368 | 39.2 | +22.1 | |
| Liberal Democrats | Ben Marshall | 111 | 11.9 | +11.9 | |
| Majority | 91 | 9.7 | |||
| Turnout | 938 | 29.6 | |||
| Labour hold | Swing | -16.2 | |||
| Party | Candidate | Votes | % | ±% | |
|---|---|---|---|---|---|
| Conservative | Philip Wheelhouse | 657 | 51.6 | +21.4 | |
| Labour | Clive Hunt | 547 | 42.9 | +1.7 | |
| Liberal Democrats | Alan Marshall | 70 | 5.5 | -4.1 | |
| Majority | 110 | 8.6 | |||
| Turnout | 1,274 | ||||
| Conservative gain from Labour | Swing | ||||
| Party | Candidate | Votes | % | ±% | |
|---|---|---|---|---|---|
| Conservative | David Drabble | 519 | 56.4 | +3.6 | |
| Labour | John Windle | 359 | 39.0 | -8.2 | |
| Liberal Democrats | Morgan Leggett | 42 | 4.6 | +4.6 | |
| Majority | 160 | 17.4 | |||
| Turnout | 920 | ||||
| Conservative hold | Swing | ||||
| Party | Candidate | Votes | % | ±% | |
|---|---|---|---|---|---|
| Conservative | Alex Platts | 748 | 55.9 | +1.9 | |
| Labour | Stuart Mullins | 479 | 35.8 | -10.2 | |
| Liberal Democrats | Mark Firth | 111 | 8.3 | +8.3 | |
| Majority | 269 | 20.1 | |||
| Turnout | 1,338 | ||||
| Conservative hold | Swing | ||||
| Party | Candidate | Votes | % | ±% | |
|---|---|---|---|---|---|
| Conservative | Bentley Strafford-Stephenson | 294 | 69.0 | +3.7 | |
| Labour | Ross Griffin | 90 | 21.1 | -0.4 | |
| Liberal Democrats | John Wilcock | 42 | 9.9 | -3.3 | |
| Majority | 204 | 47.9 | |||
| Turnout | 426 | ||||
| Conservative hold | Swing | ||||
| Party | Candidate | Votes | % | ±% | |
|---|---|---|---|---|---|
| Labour | Tony Lacey | 291 | 49.9 | +2.7 | |
| Conservative | Wendy Tinley | 251 | 43.1 | -9.7 | |
| Liberal Democrats | Mark Firth | 41 | 7.0 | +7.0 | |
| Majority | 40 | 6.9 | |||
| Turnout | 583 | ||||
| Labour gain from Conservative | Swing | ||||
| Party | Candidate | Votes | % | ±% | |
|---|---|---|---|---|---|
| Labour | Kevin Gillott | 806 | 65.9 | +34.6 | |
| Conservative | Dave Sankey | 361 | 29.5 | +14.4 | |
| Green | David Kesteven | 34 | 2.8 | +2.8 | |
| Liberal Democrats | Nadine Dart | 22 | 1.8 | -8.9 | |
| Majority | 445 | 36.4 | |||
| Turnout | 1,223 | ||||
| Labour hold | Swing | ||||