Richland County | |
---|---|
Richland County Courthouse in Wahpeton | |
Location within the U.S. state of North Dakota | |
North Dakota's location within the U.S. | |
Coordinates: 46°16′N 96°57′W / 46.27°N 96.95°W | |
Country | ![]() |
State | ![]() |
Founded | January 4, 1873 (created) November 25, 1873 (organized) |
Named for | Morgan T. Rich |
Seat | Wahpeton |
Largest city | Wahpeton |
Area | |
• Total | 1,445 sq mi (3,740 km2) |
• Land | 1,436 sq mi (3,720 km2) |
• Water | 9.7 sq mi (25 km2) 0.7% |
Population (2020) | |
• Total | 16,529 |
• Estimate (2021) | 16,560 |
• Density | 11/sq mi (4.4/km2) |
Time zone | UTC−6 (Central) |
• Summer (DST) | UTC−5 (CDT) |
Congressional district | At-large |
Website | www |
Richland County is a county in the U.S. state of North Dakota. As of the 2020 census, the population was 16,529.[1] Its county seat is Wahpeton.[2]
Richland County is part of the Wahpeton, ND–MN Micropolitan Statistical Area, which is also included in the Fargo-Wahpeton, ND-MN Combined Statistical Area.
The Dakota Territory legislature created the county on January 4, 1873, with area partitioned from Pembina County. It was named for Morgan T. Rich, who settled on the site of the future Wahpeton in 1869. The county organization was completed on November 25 of that same year. Its boundaries were altered in 1883 and 1885. It has maintained its present configuration since 1885.[3][4]
Richland County lies at the southeastern corner of North Dakota. Its eastern boundary line abuts the western boundary line of the state of Minnesota (across the Red River), and its southern boundary line abuts the northern boundary line of the state of South Dakota. The Red River flows northerly along its eastern boundary line on its way to the Hudson Bay. The Wild Rice River flows easterly and then northerly through the county, discharging into the Red River north of Richland County, in Cass County. The Sheyenne River flows northeasterly through the NW corner of the county, also discharging into the Red in Cass County.
The Richland County terrain is primarily flat, with rolling hills in the southwest and northwest. It is largely devoted to agriculture.[5] The terrain slopes to the north and east, with its highest point near its SW corner, at 1,220' (372m) ASL.[6] The county has a total area of 1,445 square miles (3,740 km2), of which 1,436 square miles (3,720 km2) is land and 9.7 square miles (25 km2) (0.7%) is water.[7]
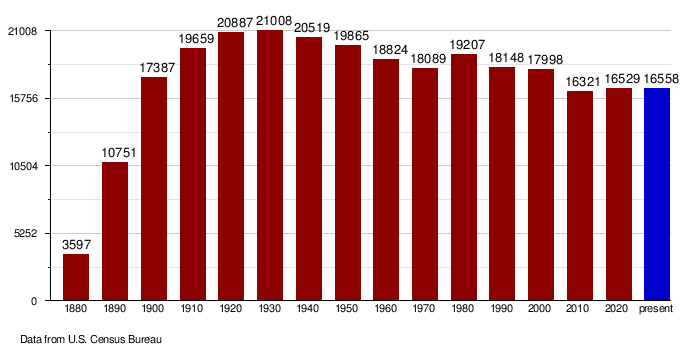
Census | Pop. | Note | %± |
---|---|---|---|
1880 | 3,597 | — | |
1890 | 10,751 | 198.9% | |
1900 | 17,387 | 61.7% | |
1910 | 19,659 | 13.1% | |
1920 | 20,887 | 6.2% | |
1930 | 21,008 | 0.6% | |
1940 | 20,519 | −2.3% | |
1950 | 19,865 | −3.2% | |
1960 | 18,824 | −5.2% | |
1970 | 18,089 | −3.9% | |
1980 | 19,207 | 6.2% | |
1990 | 18,148 | −5.5% | |
2000 | 17,998 | −0.8% | |
2010 | 16,321 | −9.3% | |
2020 | 16,529 | 1.3% | |
2021 (est.) | 16,560 | 0.2% | |
US Decennial Census[8] 1790-1960[9] 1900-1990[10] 1990-2000[11] 2010-2020[1] |
As of the 2020 census, there were 17,998 people, 6,885 households, and 4,427 families in the county. The population density was 12.3/sqmi (4.84/km2). There were 7,575 housing units at an average density of 5.28/sqmi (2.04/km2). The racial makeup of the county was 96.83% White, 0.34% Black or African American, 1.66% Native American, 0.24% Asian, 0.03% Pacific Islander, 0.14% from other races, and 0.74% from two or more races. 0.68% of the population were Hispanic or Latino of any race. 46.5% were of German and 26.9% Norwegian ancestry.
There were 6,885 households, out of which 32.4% had children under the age of 18 living with them, 54.2% were married couples living together, 6.5% had a female householder with no husband present, and 35.7% were non-families. 29.4% of all households were made up of individuals, and 11.6% had someone living alone who was 65 years of age or older. The average household size was 2.43 and the average family size was 3.06.
The county population contained 24.7% under the age of 18, 14.5% from 18 to 24, 25.6% from 25 to 44, 20.0% from 45 to 64, and 15.3% who were 65 years of age or older. The median age was 35 years. For every 100 females, there were 107.7 males. For every 100 women age 18 and over, there were 108.6 men.
The median income for a household in the county was $36,098, and the median income for a family was $45,484. Men had a median income of $30,829 versus $20,310 for women. The per capita income for the county was $16,339. About 6.1% of families and 10.4% of the population were below the poverty line, including 7.9% of those under age 18 and 9.6% of those age 65 or over.
As of the 2010 census, there were 16,321 people, 6,651 households, and 4,171 families in the county.[12] The population density was 11.4 inhabitants per square mile (4.4/km2). There were 7,503 housing units at an average density of 5.2 per square mile (2.0/km2).[13] The racial makeup of the county was 95.0% white, 2.0% American Indian, 0.7% black or African American, 0.5% Asian, 0.1% Pacific islander, 0.4% from other races, and 1.3% from two or more races. Those of Hispanic or Latino origin made up 1.7% of the population.[12] In terms of ancestry, 53.0% were German, 31.2% were Norwegian, 7.0% were Irish, and 2.3% were American.[14]
Of the 6,651 households, 28.3% had children under the age of 18 living with them, 51.6% were married couples living together, 7.1% had a female householder with no husband present, 37.3% were non-families, and 30.9% of all households were made up of individuals. The average household size was 2.31 and the average family size was 2.91. The median age was 39.4 years.[12]
The median income for a household in the county was $47,131 and the median income for a family was $64,636. Males had a median income of $42,597 versus $28,284 for females. The per capita income for the county was $24,342. About 5.2% of families and 10.7% of the population were below the poverty line, including 8.8% of those under age 18 and 11.6% of those age 65 or over.[15]
Richland County voters have traditionally voted Republican. In only one national election since 1936 has the county selected the Democratic Party candidate (as of 2020).
Year | Republican | Democratic | Third party | |||
---|---|---|---|---|---|---|
No. | % | No. | % | No. | % | |
2020 | 5,072 | 64.93% | 2,510 | 32.13% | 230 | 2.94% |
2016 | 4,767 | 62.79% | 2,064 | 27.19% | 761 | 10.02% |
2012 | 4,229 | 55.55% | 3,198 | 42.01% | 186 | 2.44% |
2008 | 3,900 | 51.57% | 3,513 | 46.45% | 150 | 1.98% |
2004 | 5,264 | 64.08% | 2,821 | 34.34% | 130 | 1.58% |
2000 | 4,999 | 62.37% | 2,490 | 31.07% | 526 | 6.56% |
1996 | 3,345 | 47.32% | 2,890 | 40.88% | 834 | 11.80% |
1992 | 3,873 | 46.66% | 2,688 | 32.38% | 1,740 | 20.96% |
1988 | 4,670 | 56.44% | 3,523 | 42.58% | 81 | 0.98% |
1984 | 5,980 | 65.48% | 3,047 | 33.36% | 106 | 1.16% |
1980 | 5,711 | 61.17% | 2,698 | 28.90% | 928 | 9.94% |
1976 | 4,991 | 51.01% | 4,592 | 46.93% | 202 | 2.06% |
1972 | 5,194 | 60.23% | 3,367 | 39.04% | 63 | 0.73% |
1968 | 4,224 | 54.38% | 3,098 | 39.89% | 445 | 5.73% |
1964 | 3,425 | 43.05% | 4,525 | 56.88% | 5 | 0.06% |
1960 | 4,711 | 54.04% | 4,003 | 45.92% | 4 | 0.05% |
1956 | 4,971 | 60.96% | 3,171 | 38.89% | 12 | 0.15% |
1952 | 6,022 | 69.78% | 2,541 | 29.44% | 67 | 0.78% |
1948 | 3,448 | 48.73% | 3,413 | 48.24% | 214 | 3.02% |
1944 | 4,402 | 57.74% | 3,192 | 41.87% | 30 | 0.39% |
1940 | 5,102 | 58.42% | 3,584 | 41.04% | 48 | 0.55% |
1936 | 2,386 | 31.41% | 3,792 | 49.92% | 1,418 | 18.67% |
1932 | 2,304 | 28.16% | 5,663 | 69.20% | 216 | 2.64% |
1928 | 4,251 | 53.89% | 3,604 | 45.68% | 34 | 0.43% |
1924 | 3,235 | 48.84% | 769 | 11.61% | 2,620 | 39.55% |
1920 | 5,483 | 79.46% | 1,339 | 19.41% | 78 | 1.13% |
1916 | 2,097 | 53.25% | 1,772 | 45.00% | 69 | 1.75% |
1912 | 1,034 | 31.95% | 1,380 | 42.65% | 822 | 25.40% |
1908 | 1,864 | 54.17% | 1,502 | 43.65% | 75 | 2.18% |
1904 | 2,420 | 66.50% | 1,116 | 30.67% | 103 | 2.83% |
1900 | 2,067 | 58.46% | 1,399 | 39.56% | 70 | 1.98% |
School districts include:[17]
Circle of Nations Wahpeton Indian School is a tribally-controlled school affiliated with the Bureau of Indian Education (BIE).