County result maps
-
 2001 results map
 -
 2005 results map
 -
 2009 results map
 -
 2013 results map
 -
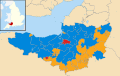
 2017 results map
 -
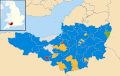
 2022 results map
Somerset County Council in England was elected every four years. Since the last boundary changes in 2001, 58 councillors were elected from 58 wards. In 2013 and 2017, 55 councillors were elected from 54 wards. In 2022, 110 councillors were elected and these transitioned over to Somerset Council, the unitary authority the replaced the county council on 1 April 2023.
Since 1974 political control of the council has been held by the following parties:[1]
| Party in control | Years | |
|---|---|---|
| Conservative | 1974–1985 | |
| No overall control | 1985–1989 | |
| Conservative | 1989–1993 | |
| Liberal Democrats | 1993–2001 | |
| No overall control | 2001–2005 | |
| Liberal Democrats | 2005–2009 | |
| Conservative | 2009–2022 | |
| Liberal Democrats | 2022–2023 | |
The leaders of the council since 2001 have been:[2]
| Councillor | Party | From | To | |
|---|---|---|---|---|
| Cathy Bakewell | Liberal Democrats | 2001 | 16 May 2007 | |
| Jill Shortland | Liberal Democrats | 16 May 2007 | 24 Jun 2009 | |
| Ken Maddock | Conservative | 24 Jun 2009 | 16 May 2012 | |
| John Osman | Conservative | 16 May 2012 | 7 May 2017 | |
| David Fothergill | Conservative | 24 May 2017 | 25 May 2022 | |
| Bill Revans | Liberal Democrats | 25 May 2022 | 31 March 2023 | |


| Party | Candidate | Votes | % | ±% | |
|---|---|---|---|---|---|
| Conservative | 1,428 | 42.6 | +7.2 | ||
| Liberal Democrats | 1,125 | 33.6 | -1.4 | ||
| Labour | 798 | 23.8 | -5.8 | ||
| Majority | 303 | 9.0 | |||
| Turnout | 3,351 | 37.0 | |||
| Conservative hold | Swing | ||||
| Party | Candidate | Votes | % | ±% | |
|---|---|---|---|---|---|
| Conservative | 948 | 68.2 | +28.7 | ||
| Liberal Democrats | 442 | 31.8 | -14.0 | ||
| Majority | 506 | 36.4 | |||
| Turnout | 1,390 | 28.0 | |||
| Conservative gain from Liberal Democrats | Swing | ||||
| Party | Candidate | Votes | % | ±% | |
|---|---|---|---|---|---|
| Conservative | Matthew Ellis | 1,568 | 51.2 | +6.9 | |
| Liberal Democrats | Ian Hasell | 1,497 | 48.8 | +9.7 | |
| Majority | 71 | 2.4 | |||
| Turnout | 3,065 | 43.8 | |||
| Conservative hold | Swing | ||||
| Party | Candidate | Votes | % | ±% | |
|---|---|---|---|---|---|
| Conservative | Margaret Robinson | 950 | 47.4 | +10.0 | |
| Liberal Democrats | Rachel Witcombe | 783 | 39.1 | +5.5 | |
| Labour | Christopher Inchley | 271 | 13.5 | -15.5 | |
| Majority | 167 | 8.3 | |||
| Turnout | 2,004 | 29.0 | |||
| Conservative hold | Swing | ||||
| Party | Candidate | Votes | % | ±% | |
|---|---|---|---|---|---|
| Conservative | John Parham | 1,307 | 41.3 | ||
| Liberal Democrats | Garfield Kennedy | 892 | 28.2 | ||
| Labour | Chris Inchley | 711 | 22.5 | ||
| Green | Ian Forster | 256 | 8.1 | ||
| Majority | 415 | 13.1 | |||
| Turnout | |||||
| Conservative hold | Swing | ||||
| Party | Candidate | Votes | % | ±% | |
|---|---|---|---|---|---|
| Liberal Democrats | Paul Maxwell | 1,333 | 53.6 | ||
| Conservative | Paul Thompson | 943 | 37.9 | ||
| Green | Ian Greenfield | 108 | 4.3 | ||
| UKIP | Godfrey Davey | 104 | 4.2 | ||
| Majority | 390 | 15.7 | |||
| Turnout | 42.8 | ||||
| Liberal Democrats gain from Conservative | Swing | ||||
| Party | Candidate | Votes | % | ±% | |
|---|---|---|---|---|---|
| Conservative | John Denbee | 1,285 | 58.0 | ||
| Liberal Democrats | Helen Groves | 932 | 42.0 | ||
| Majority | 353 | 15.9 | |||
| Turnout | |||||
| Conservative hold | Swing | ||||
| Party | Candidate | Votes | % | ±% | |
|---|---|---|---|---|---|
| Conservative | Linda Oliver | 1,163 | 47.7 | ||
| Liberal Democrats | Damon Hooton | 836 | 34.3 | ||
| Labour | Catherine Richardson | 163 | 6.7 | ||
| Independent | Adrian Dobinson | 139 | 5.7 | ||
| Green | Les Spalding | 139 | 5.7 | ||
| Majority | 327 | 13.4 | |||
| Turnout | |||||
| Conservative gain from Liberal Democrats | Swing | ||||
| Party | Candidate | Votes | % | ±% | |
|---|---|---|---|---|---|
| Conservative | Michael Adkins | 1,298 | 29.9 | ||
| Liberal Democrats | Barrie Hall | 976 | 22.5 | ||
| Labour | Libby Lisgo | 927 | 21.4 | ||
| UKIP | Robert Bainbridge | 814 | 18.8 | ||
| Green | Alan Debenham | 326 | 7.5 | ||
| Majority | 322 | 7.4 | |||
| Turnout | |||||
| Conservative gain from Liberal Democrats | Swing | ||||