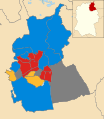
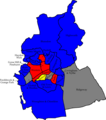
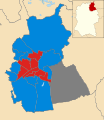
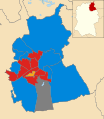
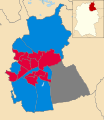
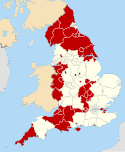
Swindon is a unitary authority in Wiltshire, England. Until 1 April 1998 its area was a non-metropolitan district called Thamesdown Borough Council, with Wiltshire County Council providing the county-level services. In 1998 all such powers were transferred to the new Borough of Swindon.
Since the first election to the new Thamesdown borough council in 1973, political control of the council has been held by the following parties:[1][2]
Party in control | Years | |
---|---|---|
Labour | 1973–1976 | |
No overall control | 1976–1978 | |
Labour | 1978–1998 |
Party in control | Years | |
---|---|---|
Labour | 1996–2000 | |
No overall control | 2000–2004 | |
Conservative | 2004–present |
Party | Candidate | Votes | % | ±% | |
---|---|---|---|---|---|
Labour | 548 | 46.3 | |||
Liberal Democrats | 300 | 25.3 | |||
Conservative | 224 | 18.9 | |||
Green | 69 | 5.8 | |||
Socialist Labour | 44 | 53.7.8 | |||
Majority | 248 | 21.0 | |||
Turnout | 1,185 | 20.7 | |||
Labour hold | Swing |
Party | Candidate | Votes | % | ±% | |
---|---|---|---|---|---|
Labour | 715 | 66.0 | -4.4 | ||
Conservative | 297 | 27.4 | +11.2 | ||
Liberal Democrats | 72 | 6.6 | -6.8 | ||
Majority | 418 | 38.6 | |||
Turnout | 1,084 | 15.2 | |||
Labour hold | Swing |
Party | Candidate | Votes | % | ±% | |
---|---|---|---|---|---|
Conservative | Raymond Fisher | 814 | 52.5 | +5.3 | |
Labour | 409 | 26.4 | -13.2 | ||
Liberal Democrats | 258 | 16.6 | +3.4 | ||
UKIP | 69 | 4.5 | +4.5 | ||
Majority | 405 | 26.1 | |||
Turnout | 1,550 | 20.6 | |||
Conservative gain from Labour | Swing |
Party | Candidate | Votes | % | ±% | |
---|---|---|---|---|---|
Labour | 513 | 37.9 | +0.3 | ||
Liberal Democrats | 359 | 26.5 | -12.1 | ||
Conservative | 229 | 16.9 | -0.6 | ||
SA | 119 | 8.8 | +8.8 | ||
Green | 71 | 5.2 | +5.2 | ||
SOU | 41 | 3.0 | -3.2 | ||
UKIP | 21 | 1.6 | +1.6 | ||
Majority | 154 | 11.4 | |||
Turnout | 1,353 | 19.4 | |||
Labour hold | Swing |
Party | Candidate | Votes | % | ±% | |
---|---|---|---|---|---|
Labour | 829 | 47.5 | +4.2 | ||
Conservative | 651 | 37.3 | +11.3 | ||
Liberal Democrats | 154 | 8.8 | -13.5 | ||
UKIP | 79 | 4.5 | -3.9 | ||
Green | 34 | 1.9 | +1.9 | ||
Majority | 178 | 10.2 | |||
Turnout | 1,747 | 23.5 | |||
Labour hold | Swing |
Party | Candidate | Votes | % | ±% | |
---|---|---|---|---|---|
Labour | Peter Mallinson | 706 | 38.4 | -3.4 | |
Conservative | 586 | 31.9 | -1.8 | ||
Liberal Democrats | 338 | 18.4 | +1.2 | ||
Independent | 106 | 5.8 | +5.8 | ||
Green | 60 | 3.3 | -3.9 | ||
UKIP | 43 | 2.3 | +2.3 | ||
Majority | 120 | 6.5 | |||
Turnout | 1,839 | 35.0 | |||
Labour gain from Conservative | Swing |
Party | Candidate | Votes | % | ±% | |
---|---|---|---|---|---|
Labour | Jenny Millin | 887 | 47.5 | +12.6 | |
Conservative | Toby Elliott | 755 | 40.4 | +1.0 | |
UKIP | William Oram | 129 | 6.9 | +6.9 | |
Liberal Democrats | Chris Ward | 98 | 5.2 | -13.3 | |
Majority | 132 | 7.1 | |||
Turnout | 1,869 | 23.7 | |||
Labour gain from Conservative | Swing |
Party | Candidate | Votes | % | ±% | |
---|---|---|---|---|---|
Conservative | Steve Weisinger | 1,453 | |||
Labour | Phil Beaumont | 1,075 | |||
UKIP | John Lenton | 195 | |||
Green | Andrew Donald Day | 111 | |||
Liberal Democrats | Cath Smith | 23 | |||
Majority | 378 | ||||
Turnout | 32.6 | ||||
Conservative hold | Swing |