![]() | |
Number of elections | 33 |
---|---|
Voted Democratic | 18 |
Voted Republican | 14 |
Voted other | 1[a] |
Voted for winning candidate | 23 |
Voted for losing candidate | 10 |
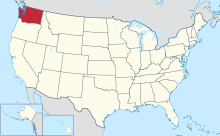
Washington is a state in the Pacific Northwest region of the United States. Since its admission to the Union in 1889, the state has participated in 33 United States presidential elections.[1]
In the 1892 presidential election, the incumbent president Benjamin Harrison received 41.45% of the popular vote and obtained 4 electoral votes from Washington.[2] Before 1932, Washington state leaned towards the Republican Party. Washington state was won by Progressive Party presidential nominee Theodore Roosevelt in 1912, which is the only time it voted for the third party's nominee as of 2023. From 1932 to 1948, Democratic candidates won Washington state in landslide victories due to the Great Depression and the New Deal.[3][4]
From 1952 to 1984, the Democratic nominee won just two of nine elections in Washington state. Since 1984, no Republican candidate has won a presidential election in Washington state. In 2009, American journalist Ron Brownstein referred to Washington and 17 other states collectively as the "Blue Wall" due to its political leaning.[5][6]
Washington state is typically thought of as politically divided by the Cascade Mountains, with Western Washington generally being liberal and Eastern Washington generally being conservative.[7] However, due to Democratic dominance in the Seattle metropolitan area, which has an extremely high population density, Washington state is a blue state in general.[8][9]
Washington state has signed the National Popular Vote Interstate Compact, an interstate compact in which signatories award all of their electoral votes to the winner of the federal-level popular vote in a presidential election, even if there are other candidate won some of individual signatorys' popular vote. However, it has not yet gone into force as of 2023.[10]
Key for parties |
---|
American Independent Party – (AI)
Constitution Party – (C)
Democratic Party – (D)
Farmer-Labor Party – (FL)
Green Party – (G)
Independent candidate – (I)
Libertarian Party – (LI)
Libertarian Party – (LI-1932)
People's Party – (PO)
Prohibition Party – (PRO)
Progressive Party (1912) – (PR-1912)
Progressive Party (1924) – (PR-1924)
Progressive Party (1948) – (PR-1948)
Reform Party – (RE)
Republican Party – (R)
Socialist Labor Party of America – (SLP)
Union Party – (U)
Note – A double dagger (‡) indicates the national winner. |
Year | Winner | Runner-up | Other candidate[b] | EV | Ref. | |||||||||
---|---|---|---|---|---|---|---|---|---|---|---|---|---|---|
Candidate | Votes | % | Candidate | Votes | % | Candidate | Votes | % | ||||||
Benjamin Harrison (R) | 36,460 | 41.4% | Grover Cleveland (D)‡ | 29,802 | 33.9% | James B. Weaver (PO) | 19,165 | 21.8% | 4 | |||||
William Jennings Bryan (D) | 53,314 | 57.0% | William McKinley (R)‡ | 39,153 | 41.8% | Joshua Levering (PRO) | 968 | 1.0% | 4 | |||||
William McKinley (R)‡ | 57,456 | 53.4% | William Jennings Bryan (D) | 44,833 | 41.7% | John Woolley (PRO) | 2,363 | 2.2% | 4 | |||||
Theodore Roosevelt (R)‡ | 101,540 | 70.0% | Alton B. Parker (D) | 28,098 | 19.4% | Eugene V. Debs (S) | 10,023 | 6.9% | 5 | |||||
William Howard Taft (R)‡ | 106,062 | 57.7% | William Jennings Bryan (D) | 58,691 | 31.9% | Eugene V. Debs (S) | 14,177 | 7.7% | 5 | |||||
Theodore Roosevelt (PR-1912) | 113,698 | 35.2% | Woodrow Wilson (D)‡ | 86,840 | 26.9% | William Howard Taft (R) | 70,445 | 21.8% | 7 | |||||
Woodrow Wilson (D)‡ | 183,388 | 48.1% | Charles Evans Hughes (R) | 167,208 | 43.9% | Allan L. Benson (S) | 22,800 | 6.0% | 7 | |||||
Warren G. Harding (R)‡ | 223,137 | 56.0% | James M. Cox (D) | 84,298 | 21.1% | Parley P. Christensen (FL) | 77,246 | 19.4% | 7 | |||||
Calvin Coolidge (R)‡ | 220,224 | 52.2% | Robert M. La Follette (PR-1924) | 150,727 | 35.8% | John W. Davis (D) | 42,842 | 10.2% | 7 | |||||
Herbert Hoover (R)‡ | 335,844 | 67.1% | Al Smith (D) | 156,772 | 31.3% | Verne L. Reynolds (SLP) | 4,068 | 0.8% | 7 | |||||
Franklin D. Roosevelt (D)‡ | 353,260 | 57.5% | Herbert Hoover (R) | 208,645 | 33.9% | William Hope Harvey (LI-1932) | 30,308 | 4.9% | 8 | |||||
Franklin D. Roosevelt (D)‡ | 459,579 | 66.4% | Alf Landon (R) | 206,892 | 29.9% | William Lemke (U) | 17,463 | 2.5% | 8 | |||||
Franklin D. Roosevelt (D)‡ | 462,145 | 58.2% | Wendell Willkie (R) | 322,123 | 40.6% | Norman Thomas (S) | 4,586 | 0.6% | 8 | |||||
Franklin D. Roosevelt (D)‡ | 486,774 | 56.8% | Thomas E. Dewey (R) | 361,689 | 42.2% | Norman Thomas (S) | 3,824 | 0.4% | 8 | |||||
Harry S. Truman (D)‡ | 486,774 | 56.8% | Thomas E. Dewey (R) | 361,689 | 42.2% | Henry A. Wallace (PR-1948) | 3,824 | 0.4% | 8 | |||||
Dwight D. Eisenhower (R)‡ | 599,107 | 54.3% | Adlai Stevenson (D) | 492,845 | 44.7% | Douglas MacArthur (C) | 7,290 | 0.7% | 9 | |||||
Dwight D. Eisenhower (R)‡ | 620,430 | 53.9% | Adlai Stevenson (D) | 523,002 | 45.4% | Eric Hass (SLP) | 7,457 | 0.6% | 9 | |||||
Richard Nixon (R) | 620,430 | 50.7% | John F. Kennedy (D)‡ | 523,002 | 48.3% | Eric Hass (SLP) | 7,457 | 0.9% | 9 | |||||
Lyndon B. Johnson (D)‡ | 779,881 | 62.0% | Barry Goldwater (R) | 470,366 | 37.4% | Eric Hass (SLP) | 7,772 | 0.6% | 9 | |||||
Hubert Humphrey (D) | 616,037 | 47.2% | Richard Nixon (R)‡ | 588,510 | 45.1% | George Wallace (AI) | 96,990 | 7.4% | 9 | |||||
Richard Nixon (R)‡ | 837,135 | 56.9% | George McGovern (D) | 568,334 | 38.6% | John G. Schmitz (AI) | 58,906 | 4% | 9 | |||||
Gerald Ford (R) | 717,323 | 50.0% | Jimmy Carter (D)‡ | 717,323 | 46.1% | Eugene McCarthy (I) | 36,986 | 2.4% | 8[c] | |||||
Ronald Reagan (R)‡ | 865,244 | 49.7% | Jimmy Carter (D) | 650,193 | 37.3% | John B. Anderson (I) | 185,073 | 10.6% | 9 | |||||
Ronald Reagan (R)‡ | 1,051,670 | 55.8% | Walter Mondale (D) | 807,352 | 42.9% | David Bergland (LI) | 8,844 | 0.5% | 10 | |||||
Michael Dukakis (D) | 933,516 | 50.0% | George H. W. Bush (R)‡ | 903,835 | 48.5% | Ron Paul (LI) | 17,240 | 0.9% | 10 | |||||
Bill Clinton (D)‡ | 993,037 | 43.4% | George H. W. Bush (R) | 731,234 | 32.0% | Ross Perot (I) | 541,780 | 23.7% | 11 | |||||
Bill Clinton (D)‡ | 1,123,323 | 49.8% | Bob Dole (R) | 840,712 | 37.3% | Ross Perot (RE) | 201,003 | 8.9% | 11 | |||||
Al Gore (D) | 1,247,652 | 50.1% | George W. Bush (R)‡ | 1,108,864 | 44.6% | Ralph Nader (G) | 103,002 | 4.1% | 11 | |||||
John Kerry (D) | 1,510,201 | 52.8% | George W. Bush (R)‡ | 1,304,894 | 45.6% | Ralph Nader (I) | 23,283 | 0.8% | 11 | |||||
Barack Obama (D)‡ | 1,750,848 | 57.3% | John McCain (R) | 1,229,216 | 40.2% | Ralph Nader (I) | 29,489 | 1% | 11 | |||||
Barack Obama (D)‡ | 1,755,396 | 56.2% | Mitt Romney (R) | 1,290,670 | 41.3% | Gary Johnson (LI) | 42,202 | 1.4% | 12 | |||||
Hillary Clinton (D) | 1,742,718 | 52.5% | Donald Trump (R)‡ | 1,221,747 | 36.8% | Gary Johnson (LI) | 160,879 | 4.9% | 8[d] | |||||
Joe Biden (D)‡ | 2,369,612 | 58.0% | Donald Trump (R) | 1,584,651 | 38.8% | Jo Jorgensen (LI) | 80,500 | 2% | 12 |