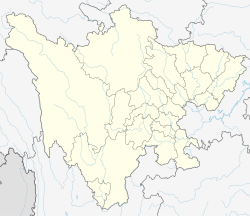
County-level city in Sichuan, China
Wanyuan (simplified Chinese: 万源; traditional Chinese: 萬源; pinyin: Wànyuán; lit. 'ten thousand springs') is a county-level city in the northeast of Sichuan province, China, located near the trisection of Sichuan, Chongqing, and Shaanxi. Tamping Township is its municipality seat. Wanyuan has more than 100.000 inhabitants.
Administrative divisions
Wanyuan comprises 1 subdistrict, 25 towns and 5 townships:[1]
- subdistricts
- towns
- Taiping 太平镇
- Qinghua 青花镇
- Jiuyuan 旧院镇
- Luowen 罗文镇
- Hekou 河口镇
- Caoba 草坝镇
- Zhuyu 竹峪镇
- Dazhu 大竹镇
- Huangzhong 黄钟镇
- Guandu官渡镇
- Baisha 白沙镇
- Shatan 沙滩镇
- Shiwo 石窝镇
- Batai 八台镇
- Shitang 石塘镇
- Tiekuang 铁矿镇
- Dasha 大沙镇
- Weijia 魏家镇
- Baiguo 白果镇
- Changba 长坝镇
- Jingxi 井溪镇
- Yingbei 鹰背镇
- Yongning 永宁镇
- Gujun 固军镇
- Heibaoshan 黑宝山镇
- townships
- Fengtong 蜂桶乡
- Zengjia 曾家乡
- Yudai 玉带乡
- Miaozi 庙子乡
- Zixi 紫溪乡
Geography and climate
Wanyuan has a monsoon-influenced humid subtropical climate (Köppen Cwa), with cool, damp winters and hot, humid summers; winter temperatures are significantly cooler than in the Sichuan Basin. The monthly 24-hour average temperature ranges from 4.1 °C (39.4 °F) in January to 24.9 °C (76.8 °F) in July and August, the latter figure being comparable to Chengdu, while the annual mean is 14.81 °C (58.7 °F). About two-thirds of the 1,271 mm (50.0 in) of annual precipitation occurs from June to September. With monthly percent possible sunshine ranging from 20% in January and February to 49% in August, the city receives 1,372 hours of bright sunshine annually, with spring sunnier than autumn.
| Climate data for Wanyuan (1991–2020 normals, extremes 1971–2010)
|
| Month
|
Jan
|
Feb
|
Mar
|
Apr
|
May
|
Jun
|
Jul
|
Aug
|
Sep
|
Oct
|
Nov
|
Dec
|
Year
|
| Record high °C (°F)
|
19.9
(67.8)
|
25.0
(77.0)
|
30.8
(87.4)
|
34.8
(94.6)
|
37.5
(99.5)
|
38.6
(101.5)
|
39.2
(102.6)
|
39.2
(102.6)
|
36.8
(98.2)
|
31.2
(88.2)
|
26.6
(79.9)
|
20.3
(68.5)
|
39.2
(102.6)
|
| Mean daily maximum °C (°F)
|
8.7
(47.7)
|
11.3
(52.3)
|
16.4
(61.5)
|
22.2
(72.0)
|
25.5
(77.9)
|
28.6
(83.5)
|
31.1
(88.0)
|
31.1
(88.0)
|
25.8
(78.4)
|
20.5
(68.9)
|
15.5
(59.9)
|
10.2
(50.4)
|
20.6
(69.0)
|
| Daily mean °C (°F)
|
4.2
(39.6)
|
6.5
(43.7)
|
10.6
(51.1)
|
15.8
(60.4)
|
19.5
(67.1)
|
23.0
(73.4)
|
25.4
(77.7)
|
25.0
(77.0)
|
20.4
(68.7)
|
15.4
(59.7)
|
10.4
(50.7)
|
5.6
(42.1)
|
15.2
(59.3)
|
| Mean daily minimum °C (°F)
|
1.0
(33.8)
|
3.0
(37.4)
|
6.3
(43.3)
|
11.0
(51.8)
|
15.0
(59.0)
|
18.7
(65.7)
|
21.4
(70.5)
|
20.8
(69.4)
|
16.9
(62.4)
|
12.2
(54.0)
|
7.0
(44.6)
|
2.4
(36.3)
|
11.3
(52.4)
|
| Record low °C (°F)
|
−8.9
(16.0)
|
−6.8
(19.8)
|
−4.8
(23.4)
|
0.0
(32.0)
|
5.9
(42.6)
|
9.9
(49.8)
|
12.6
(54.7)
|
13.4
(56.1)
|
9.1
(48.4)
|
−2
(28)
|
−3.4
(25.9)
|
−9.4
(15.1)
|
−9.4
(15.1)
|
| Average precipitation mm (inches)
|
5.7
(0.22)
|
13.9
(0.55)
|
33.5
(1.32)
|
72.9
(2.87)
|
140.9
(5.55)
|
190.9
(7.52)
|
272.7
(10.74)
|
179.9
(7.08)
|
197.8
(7.79)
|
113.2
(4.46)
|
38.8
(1.53)
|
7.8
(0.31)
|
1,268
(49.94)
|
| Average precipitation days (≥ 0.1 mm)
|
5.4
|
6.4
|
9.6
|
12.2
|
13.4
|
13.9
|
15.0
|
12.6
|
13.7
|
13.4
|
8.7
|
6.3
|
130.6
|
| Average snowy days
|
4.9
|
2.7
|
1.0
|
0.1
|
0
|
0
|
0
|
0
|
0
|
0
|
0.3
|
2.1
|
11.1
|
| Average relative humidity (%)
|
67
|
65
|
65
|
68
|
70
|
75
|
77
|
75
|
78
|
79
|
75
|
70
|
72
|
| Mean monthly sunshine hours
|
66.4
|
64.6
|
105.9
|
137.7
|
147.7
|
154.2
|
187.1
|
194.7
|
118.0
|
95.1
|
82.2
|
70.6
|
1,424.2
|
| Percent possible sunshine
|
21
|
20
|
28
|
35
|
34
|
36
|
43
|
48
|
32
|
27
|
26
|
23
|
31
|
| Source 1: China Meteorological Administration[2][3]
|
| Source 2: Weather China[4]
|
