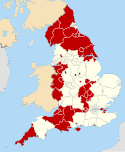
Wokingham Borough Council is the local authority for the Borough of Wokingham, a unitary authority in Berkshire, England. Until 1 April 1998 it was a non-metropolitan district.
Since the first election to the council in 1973 political control of the council has been held by the following parties:[1][2]
Non-metropolitan district
Party in control | Years | |
---|---|---|
No overall control | 1973–1976 | |
Conservative | 1976–1995 | |
No overall control | 1995–1996 | |
Liberal Democrats | 1996–1997 | |
Conservative | 1997–1998 |
Unitary authority
Party in control | Years | |
---|---|---|
Conservative | 1998–2000 | |
No overall control | 2000–2002 | |
Conservative | 2002–2022 | |
No overall control | 2022–present |
Since 1995, the leaders of the council have been:
Councillor | Party | From | To | |
---|---|---|---|---|
Simon Etheridge | Conservative | 1995 | 1996 | |
Alan Spratling | Liberal Democrats | 1996 | 1997 | |
Simon Etheridge | Conservative | 1997[3] | 1999[4] | |
Perry Lewis | Conservative | 1999[5] | 2000 | |
Alan Spratling | Liberal Democrats | 2000[6] | 2002 | |
Frank Browne | Conservative | 2002 | 2008[7] | |
David Lee | Conservative | 2008[8] | 2014 | |
Keith Baker | Conservative | 2014[9] | 2017 | |
Charlotte Haitham Taylor | Conservative | 2017[10] | 2018 | |
Julian McGhee-Sumner | Conservative | 2018[11] | 2019 | |
John Halsall | Conservative | 2019[12] | 2022 | |
Clive Jones | Liberal Democrats | 2022[13] | present |
Party | Candidate | Votes | % | ±% | |
---|---|---|---|---|---|
Liberal Democrats | 540 | 44.3 | +2.7 | ||
Labour | 456 | 37.4 | +3.7 | ||
Conservative | 222 | 18.2 | -6.5 | ||
Majority | 84 | 6.9 | |||
Turnout | 1,218 | 39.6 | |||
Liberal Democrats hold | Swing |
Party | Candidate | Votes | % | ±% | |
---|---|---|---|---|---|
Conservative | 303 | 78.1 | -2.8 | ||
UKIP | 45 | 11.6 | +11.6 | ||
Liberal Democrats | 40 | 10.3 | -0.8 | ||
Majority | 258 | 66.5 | |||
Turnout | 388 | 22.7 | |||
Conservative hold | Swing |
Party | Candidate | Votes | % | ±% | |
---|---|---|---|---|---|
Liberal Democrats | Malcolm Armstrong | 751 | 51.5 | +13.1 | |
Conservative | 622 | 42.6 | +1.0 | ||
UKIP | 86 | 5.9 | -8.5 | ||
Majority | 129 | 8.9 | |||
Turnout | 1,459 | 24.0 | |||
Liberal Democrats gain from Conservative | Swing |
Party | Candidate | Votes | % | ±% | |
---|---|---|---|---|---|
Conservative | Stuart Munro | 405 | 60.5 | -18.3 | |
Independent | Max Bowker | 120 | 17.9 | +17.9 | |
Liberal Democrats | Caroline Smith | 109 | 16.3 | -4.9 | |
UKIP | Vince Pearson | 35 | 5.2 | +5.2 | |
Majority | 254 | 42.6 | |||
Turnout | 669 | ||||
Conservative hold | Swing |
Party | Candidate | Votes | % | ±% | |
---|---|---|---|---|---|
Conservative | Paul Swaddle | 1,027 | 51.0 | +8.6 | |
Liberal Democrats | Dave Swindells | 835 | 41.5 | +11.5 | |
Labour | Jacqueline Rupert | 97 | 4.8 | -5.3 | |
UKIP | David Lamb | 55 | 2.7 | -8.1 | |
Majority | 192 | 9.5 | |||
Turnout | 2,014 | 28.2 | |||
Conservative hold | Swing |
Party | Candidate | Votes | % | ±% | |
---|---|---|---|---|---|
Conservative | John Kersley | 913 | 70.6 | -2.9 | |
Liberal Democrats | Martin Alder | 237 | 18.3 | -0.5 | |
UKIP | Franklin Carstairs | 83 | 6.4 | +2.5 | |
Labour | Brian Scott | 60 | 4.6 | +0.8 | |
Majority | 676 | 52.3 | |||
Turnout | 1,293 | ||||
Conservative hold | Swing |
Party | Candidate | Votes | % | ±% | |
---|---|---|---|---|---|
Conservative | Katherine Povey | 850 | 53.2 | +0.0 | |
Liberal Democrats | Coling Lawley | 675 | 42.2 | +4.6 | |
UKIP | Amy Thornton | 74 | 4.6 | -0.2 | |
Majority | 175 | 11.0 | |||
Turnout | 1,599 | ||||
Conservative hold | Swing |
Party | Candidate | Votes | % | ±% | |
---|---|---|---|---|---|
Conservative | David Sleight | 1,809 | 67.3 | -8.9 | |
Liberal Democrats | David Vaughan | 711 | 26.5 | +13.0 | |
BNP | Mark Burke | 166 | 6.2 | +6.2 | |
Majority | 1,098 | 40.8 | |||
Turnout | 2,686 | 44.5 | |||
Conservative hold | Swing |
Party | Candidate | Votes | % | ±% | |
---|---|---|---|---|---|
Conservative | John Halsall | 850 | 65.9 | +0.6 | |
Liberal Democrats | Martin Alder | 272 | 21.1 | -7.1 | |
Labour | Matthew Dent | 94 | 7.3 | +0.7 | |
UKIP | Andy Heape | 55 | 4.3 | +4.3 | |
Green | Martyn Foss | 19 | 1.5 | +1.5 | |
Majority | 578 | 44.8 | |||
Turnout | 1,290 | 29.4 | |||
Conservative hold | Swing |
Party | Candidate | Votes | % | ±% | |
---|---|---|---|---|---|
Liberal Democrats | Imogen Shepherd-DuBey | 1,575 | 59.7 | +22.6 | |
Conservative | Kevin Morgan | 879 | 33.3 | -4.2 | |
UKIP | Phil Ray | 104 | 3.9 | -11.5 | |
Labour | Christopher Everett | 79 | 3.0 | -6.9 | |
Majority | 696 | 26.4 | |||
Turnout | 2,637 | 39.7 | –3.4 | ||
Liberal Democrats gain from Conservative | Swing |
Party | Candidate | Votes | % | ±% | |
---|---|---|---|---|---|
Liberal Democrats | Sarah Kerr | 1,441 | 63.1 | 16.3 | |
Conservative | Daniel Clawson | 729 | 31.9 | -8.8 | |
Labour | Timothy Lloyd | 115 | 5 | -7.5 | |
Majority | 713 | 31 | 35.1 | ||
Turnout | 2,294 | 32.7 | -8.3 | ||
Liberal Democrats hold | Swing |