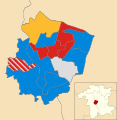
One third of Worcester City Council (technically a District Council) in Worcestershire, England, is elected each year, followed by one year without election. Since the last boundary changes in 2004, 35 councillors have been elected from 15 wards.[1]
Since the first election to the council in 1973 political control of the council has been held by the following parties:[2][3]
Party in control | Years |
---|---|
No overall control | 1973 - 1976 |
Conservative | 1976 - 1980 |
Labour | 1980 - 1983 |
No overall control | 1983 - 1986 |
Labour | 1986 - 2000 |
No overall control | 2000 - 2003 |
Conservative | 2003 - 2007 |
No overall control | 2007 - 2011 |
Conservative | 2011 - 2012 |
No overall control | 2012 - 2015 |
Conservative | 2015 - 2016 |
No overall control | 2016–2021 |
Conservative | 2021–2022 |
No overall control | 2022-present |
Party | Candidate | Votes | % | ±% | |
---|---|---|---|---|---|
Labour | 633 | 70.0 | |||
Liberal Democrats | 171 | 18.9 | |||
Conservative | 100 | 11.0 | |||
Majority | 462 | 51.1 | |||
Turnout | 904 | 21.1 | |||
Labour hold | Swing |
Party | Candidate | Votes | % | ±% | |
---|---|---|---|---|---|
Labour | Jennifer Barnes | 604 | 42.5 | +19.5 | |
Conservative | Lisa Ventura-Whiting | 478 | 33.6 | -15.8 | |
BNP | Peter Beechey | 166 | 11.7 | -4.1 | |
UKIP | John Butterfield | 122 | 8.6 | +8.6 | |
Green | Olaf Twiehaus | 52 | 3.7 | -8.1 | |
Majority | 126 | 8.9 | |||
Turnout | 1,422 | 31.4 | |||
Labour gain from Conservative | Swing |
Party | Candidate | Votes | % | ±% | |
---|---|---|---|---|---|
Conservative | Bill Amos | 1,457 | 56.3 | +13.2 | |
Labour | Jennifer Barnes | 816 | 31.6 | +5.6 | |
Green | Daniel Daye | 189 | 7.3 | +1.4 | |
UKIP | Paul Hickling | 124 | 4.8 | -9.6 | |
Majority | 641 | 24.8 | |||
Turnout | 2,586 | ||||
Conservative hold | Swing |