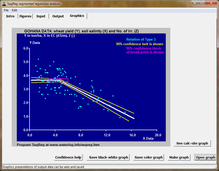
 Screenshot of graphics tab sheet | |
| Developer(s) | Institute for Land Reclamation and Improvement (ILRI) |
|---|---|
| Written in | Delphi |
| Operating system | Microsoft Windows |
| Available in | English |
| Type | Statistical software |
| License | Proprietary Freeware |
| Website | SegReg |
In statistics and data analysis, the application software SegReg is a free and user-friendly tool for linear segmented regression analysis to determine the breakpoint where the relation between the dependent variable and the independent variable changes abruptly.[1]
Features
[edit]


SegReg permits the introduction of one or two independent variables. When two variables are used, it first determines the relation between the dependent variable and the most influential independent variable, where after it finds the relation between the residuals and the second independent variable. Residuals are the deviations of observed values of the dependent variable from the values obtained by segmented regression on the first independent variable.
The breakpoint is found numerically by adopting a series tentative breakpoints and performing a linear regression at both sides of them. The tentative breakpoint that provides the largest coefficient of determination (as a parameter for the fit of the regression lines to the observed data values) is selected as the true breakpoint. To assure that the lines at both sides of the breakpoint intersect each other exactly at the breakpoint, SegReg employs two methods and selects the method giving the best fit.
SegReg recognizes many types of relations and selects the ultimate type on the basis of statistical criteria like the significance of the regression coefficients. The SegReg output provides statistical confidence belts of the regression lines and a confidence block for the breakpoint.[2] The confidence level can be selected as 90%, 95% and 98% of certainty.
To complete the confidence statements, SegReg provides an analysis of variance and an Anova table.[3]
During the input phase, the user can indicate a preference for or an exclusion of a certain type. The preference for a certain type is only accepted when it is statistically significant, even when the significance of another type is higher.
ILRI [4] provides examples of application to magnitudes like crop yield, watertable depth, and soil salinity.
A list of publications in which SegReg is used can be consulted.[5]
Equations
[edit]When only one independent variable is present, the results may look like:
- X < BP ==> Y = A1.X + B1 + RY
- X > BP ==> Y = A2.X + B2 + RY
where BP is the breakpoint, Y is the dependent variable, X the independent variable, A the regression coefficient, B the regression constant, and RY the residual of Y. When two independent variables are present, the results may look like:
- X < BPX ==> Y = A1.X + B1 + RY
- X > BPX ==> Y = A2.X + B2 + RY
- Z < BPZ ==> RY = C1.Z + D1
- Z > BPZ ==> RY = C2.Z + D2
where, additionally, BPX is BP of X, BPZ is BP of Z, Z is the second independent variable, C is the regression coefficient, and D the regression constant for the regression of RY on Z.
Substituting the expressions of RY in the second set of equations into the first set yields:
- X < BPX and Z < BPZ ==> Y = A1.X + C1.Z + E1
- X < BPX and Z > BPZ ==> Y = A1.X + C2.Z + E2
- X > BPX and Z < BPZ ==> Y = A2.X + C1.Z + E3
- X > BPX and Z > BPZ ==> Y = A2.X + C2.Z + E4
where E1 = B1+D1, E2 = B1+D2, E3 = B2+D1, and E4 = B2+D2 .
Alternative
[edit]
As an alternative to regressions at both sides of the breakpoint (threshold), the method of partial regression can be used to find the longest possible horizontal stretch with insignificant regression coefficient, outside of which there is a definite slope with a significant regression coefficient. The alternative method can be used for segmented regressions of Type 3 and Type 4 when it is the intention to detect a tolerance level of the dependent variable for varying quantities of the independent, explanatory, variable (also called predictor).[6]
The attached figure concerns the same data as shown in the blue graph in the infobox at the top of this page. Here, the wheat crop has a tolerance for soil salinity up to the level of EC=7.1 dS/m instead of 4.6 in the blue figure. However, the fit of the data beyond the threshold is not as well as in the blue figure that has been made using the principle of minimization of the sum of squares of deviations of the observed values from the regression lines over the whole domain of explanatory variable X (i.e. maximization of the coefficient of determination), while the partial regression is designed only to find the point where the horizontal trend changes into a sloping trend.
See also
[edit]References
[edit]- ^ Statistical principles of segmented regression with break-point
- ^ determination of the confidence interval of the break-point
- ^ F-tests in the analysis of variance for segmented linear regression
- ^ Drainage research in farmers' fields: analysis of data, 2002. Contribution to the project “Liquid Gold” of the International Institute for Land Reclamation and Improvement (ILRI), Wageningen, The Netherlands. [1]
- ^ List of publications using SegReg
- ^ Free software for partial regression