I am a Londoner who lives and works as Marketing Director for King's Group in Madrid, Spain. I haven't updated my football league charts recently. If you are interested in making your own graphs of football league positions and other obscure football charts you should leave a message below:
-
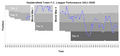
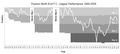
 Cumulative Goal Difference for Chelsea F.C. under their various managers and two owners
 -
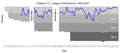
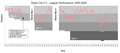
 Love them or hate them no doubt Manchester United's goal difference is very consistent.
 -
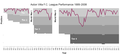
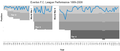
 Everton's Cumulative Goal Difference. Shows a significant change at the end of the 1998-1999 season accumulating a goal difference of nine in the last six matches; this seems to be just before chairman Peter Johnson resigned and Bill Kenwright's took over.
 -
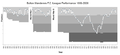
 Spurs' managers get changed quite often
 -
 Arsenal's Arsene Wenger's consistency shows quite clearly on this chart
 -
 Chart showing the cumulative goal difference of Aston Villa F.C. from the inaugural season of The Premiere League to October 25 2009
 -
 Chart showing the cumulative goal difference under different managers of Liverpool FC from the inaugural season of The Premiere League to October 22 2009
 -
 Huddersfield Town F.C. - first club to be updated to 2009
 -
-

-
 Manchester United F.C. - starts as Newton Heath F.C. in green and gold
 -
 Hull City A.F.C. Historical
 -
 Hull City A.F.C. Recent
 -
 Aston Villa F.C.; my first graph showing a club that has played in every season of the English football league system from 1888-89 to 2007-8
 -
 Preston North End F.C. another club with a long history nicely shown in the rollercoaster shaped graph.
 -
 Stoke City F.C. red and white striped line reflecting their shirts was a bit of a struggle to make, but worth it I think.
 -
 Everton F.C. only one trip into the second tier since WWII for The Toffees.
 -
 Graph showing the cumulative goal difference of Stoke City F.C. in Football League competitions 1997-2008 under different managers.
 -
 Wolves F.C. graph shows the three consecutive relegations in 1984, 1985 and 1986 that took them into the fourth tier in the mid-80s.
 -
 Blackburn Rovers F.C. seem to have an generally upward trend since the early 1970s despite the yo-yo-ing and the impressive spike paid for by Jack Walker.
 -
 Using small blue dots on each node to reflect the dark blue trim on Bolton Wanderers F.C.'s kit.
 -

-
 Surprisingly this isn't going to be the smallest graph that I make. The original Bootle F.C. were in the league for just one season (1893) and an outfit from Essex called Thames A.F.C. played in two seasons (1930-31 and 1931-32)
 -
 I had forgotten that the magpies had almost made it into the Premier League. Sad to see their decline.
 -
 Burnley F.C.'s graph just leaves (Derby County) to complete all 12 of the founding clubs in the football league.
 -
 Derby County F.C. - last graph of the founding league clubs!
 -
 Struway2 has pointed out the mistake in tier 4 numbers - which I need to correct.
 -
 Strange graph on the S.S. Lazio page - Andrea 93 has asked me to help make a new one. :-)


I'll be adding a graph for every club in the top four tiers of the English and Scottish leagues - then I plan to make graphs for clubs in the top tier of the Spanish, French, Italian and German leagues.
The latest version of OpenOffice allows me to export anti-aliased images direct from the charting package - this will help my plans to automate the production of the graphs.
Next on my to-do list are:
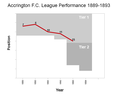
Preston North EndAston VillaWolverhampton WanderersBlackburn RoversBolton WanderersWest Bromwich AlbionAccringtonEvertonBurnleyDerby CountyNotts CountyStoke City F.C.
Making a graph for your own team - or improving on one that I have made - isn't difficult. I use the charting package included with OpenOffice.org Calc to create the basic graph from a simple spreadsheet then I add labels with the OpenOffice.org drawing package. If you want help getting started or data then message me on my talk page or find me on Statnav.