Nuneaton and Bedworth Borough Council elections are held every other year, with half the council being elected each time. Nuneaton and Bedworth Borough Council is the local authority for the non-metropolitan district of Nuneaton and Bedworth in Warwickshire, England. Since the last boundary changes in 2002, 34 councillors have been elected from 17 wards. Prior to 2002 elections were held three years out of every four, with a third of the council elected each time.[1]
Council elections in Warwickshire
 2002 results map
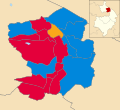 2004 results map
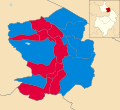 2006 results map
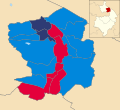 2008 results map
 2010 results map
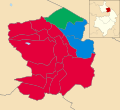 2012 results map
 2014 results map
 2016 results map
 2018 results map
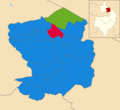 2021 results map
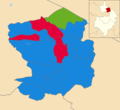 2022 results map


