The following is a list of all light rail systems in the United States, ranked by ridership. Also included are those urban streetcar/trolley systems that are providing regular public transit service (i.e. operating year-round and at least five days/week). This list does not include statistics for metro/rapid transit systems (see: the List of United States rapid transit systems by ridership for those). Daily and annual ridership figures are based on "average weekday unlinked passenger trips" (where transfers between lines are counted as two separate passenger "boardings" or "trips"). The annual ridership figures for 2016 and average weekday ridership figures for the fourth quarter (Q4) of 2016 come from the American Public Transportation Association's (APTA) Ridership Reports statistics for the fourth quarter (Q4) of 2016,[1] unless otherwise noted (e.g. NJ Transit systems). References with supplementary (i.e. non-APTA) ridership figures are included in the System column.
Systems excluded from ridership table
The following light rail systems have been excluded from the ridership table above:
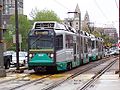 MBTA Green Line
 LACMTA Gold Line
 Muni Metro's T Third line
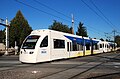
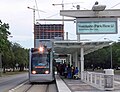
 DART Green Line
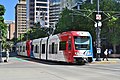
 METRO Blue Line
 St. Louis MetroLink Train
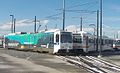


 Houston METRORail Red Line
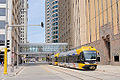
 Seattle Link Light Rail
 Seattle Streetcar South Lake Union Line
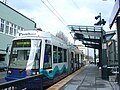


.jpg)

.jpg)

