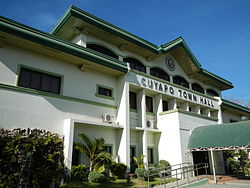
Municipality in Nueva Ecija, Philippines
Municipality in Central Luzon, Philippines
Cuyapo [ˌkujaˈpɔ(ʔ)], officially the Municipality of Cuyapo (Ilocano: Ili ti Cuyapo; Tagalog: Bayan ng Cuyapo), is a 1st class municipality in the province of Nueva Ecija, Philippines. According to the 2020 census, it has a population of 68,066 people.[3]
Cuyapo is 53 kilometres (33 mi) from Cabanatuan, 67 kilometres (42 mi) from Palayan, and 169 kilometres (105 mi) from Manila.
Etymology
Cuyapo is named after the water cabbage (Pistia stratiotes) which is known in Pangasinense as kuyapo.[5] The district of Quiapo, Manila is also named after the same plant, this is the Tagalog counterpart, modern spelling kiyapo.[6]
History
Early beginnings
Pangasinenses from Paniqui, Tarlac who used to pasture their cattle, other Pangasinenses from Calasiao and San Carlos, Pangasinan, Ilocano foresters from Santa Maria, Narvacan, Ilocos Sur; Paoay and Batac in Ilocos Norte; and some Tagalogs from Bulacan & south Nueva Ecija settled in great number in the town. It is said that the exodus, particularly from Ilocos Sur, was due to the forced labor enforced by the Spaniards in the construction of the Catholic Church in Santa Maria, Ilocos Sur. Cuyapo was declared a Barrio of Rosales on September 25, 1849, with Senior Santiago Vergara as its first Teniente del Barrio. Rosales was then a part of Nueva Ecija. It was in 1901 during the American Civil Commission that Rosales, together with Balungao, Umingan, San Quintin, were segregated from Nueva Ecija and became parts of Pangasinan.
Creation of the Town
On October 29, 1859, Cuyapo was separated from Rosales, Pangasinan and made a full-fledged town with Don Juan Pangalilingan as the first Gobernadorcillo. It was during his term that the first Catholic Church and convent was constructed. The old road to Guimba, passing through what is now Barangay Maycaban was constructed. On October 29, 1959, Cuyapo celebrated the centennial of its creation as a town.
The Revolutionary Period
On July 1, 1898, Gen. Mariano Llanera, then Military Governor of Nueva Ecija, appointed Don Marcelo Garcia, last Capitan Municipal during the Spanish Regime, as Presidente Municipal with Don Mariano Flores, last Teniente Mayor, as Vise Presidente Municipal. Later, under the supervisonal government, election of municipal officials was held. This revolutionary period of government existed until the American forces came in November 1898. It was during this period when the people showed their patriotism and loyalty to the cause of the revolution. On June 19, 1898, two to three hundred Cuyapenos, under Teniente Isabelo del Valle of Paniqui, Tarlac, answered the call of duty and ambushed a heavily armed contingent of Spanish Cazadores who came from Rosales en route to Tarlac in Bessang (now part of Barangay Maycaban. The Cuyapenos then had only fifteen (15) Remington rifles and the rest armed with bolos.
Geography
Barangays
Cuyapo is politically subdivided into 51 barangays. Each barangay consists of puroks and some have sitios.
- Baloy
- Bambanaba
- Bantug
- Bentigan
- Bibiclat
- Bonifacio
- Bued
- Bulala
- Burgos
- Cabileo
- Cabatuan
- Cacapasan
- Calancuasan Norte
- Calancuasan Sur
- Colosboa
- Columbitin
- Curva
- District I (Pob. I)
- District II (Pob. II)
- District IV (Pob. IV)
- District V (Pob. V)
- District VI (Pob. VI)
- District VII (Pob. VII)
- District VIII (Pob. VIII)
- Landig
- Latap
- Loob
- Luna
- Malbeg-Patalan
- Malineng
- Matindeg
- Maycaban
- Nagcuralan
- Nagmisahan
- Paitan Norte
- Paitan Sur
- Piglisan
- Pugo
- Rizal
- Sabit
- Salagusog
- San Antonio (Butao)
- San Jose
- San Juan
- Santa Clara
- Santa Cruz
- Simimbaan
- Tagtagumbao
- Tutuloy
- Ungab
- Villaflores
Climate
| Climate data for Cuyapo, Nueva Ecija
|
| Month
|
Jan
|
Feb
|
Mar
|
Apr
|
May
|
Jun
|
Jul
|
Aug
|
Sep
|
Oct
|
Nov
|
Dec
|
Year
|
| Mean daily maximum °C (°F)
|
30
(86)
|
31
(88)
|
33
(91)
|
35
(95)
|
33
(91)
|
31
(88)
|
30
(86)
|
29
(84)
|
29
(84)
|
30
(86)
|
31
(88)
|
30
(86)
|
31
(88)
|
| Mean daily minimum °C (°F)
|
19
(66)
|
19
(66)
|
20
(68)
|
22
(72)
|
24
(75)
|
24
(75)
|
24
(75)
|
24
(75)
|
23
(73)
|
22
(72)
|
21
(70)
|
20
(68)
|
22
(71)
|
| Average precipitation mm (inches)
|
3
(0.1)
|
2
(0.1)
|
5
(0.2)
|
10
(0.4)
|
80
(3.1)
|
107
(4.2)
|
138
(5.4)
|
147
(5.8)
|
119
(4.7)
|
70
(2.8)
|
26
(1.0)
|
8
(0.3)
|
715
(28.1)
|
| Average rainy days
|
2.0
|
1.7
|
2.7
|
4.6
|
16.1
|
20.8
|
24.0
|
23.0
|
21.4
|
15.5
|
8.0
|
3.2
|
143
|
| Source: Meteoblue (modeled/calculated data, not measured locally)[7]
|
Economy
Poverty Incidence of Cuyapo


