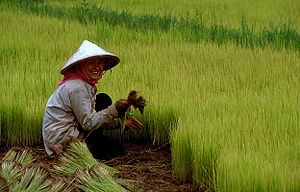
The following list, derived from the statistics of the United Nations' Food and Agriculture Organization (FAO), lists the most valuable agricultural products produced by the countries of the world.[1] The data in this article, unless otherwise noted, was reported for 2016. The value and production of individual crops varies substantially from year to year as prices fluctuate on the world and country markets and weather and other factors influence production.
This list includes the top 50 most valuable crops and livestock products but does not necessarily include the top 50 most heavily produced crops and livestock products. Indigenous meat values have been omitted from this table.
| Crop or Livestock | Global gross production value in billion US$ | Global production in metric tons | Country with highest gross production value in billion USD |
|---|---|---|---|
| Rice, paddy | $332 | 751,885,117 | $117 (Mainland China) |
| Pig, meat | $280 | 118,956,327 | $167 (Mainland China) |
| Cattle, meat | $269 | 64,568,004 | $52.8 (United States) |
| Cow's milk, whole fresh | $238 | 665,596,536 | $34.7 (United States) |
| Chicken, meat | $192 | 106,638,508 | $27.4 (United States) |
| Maize (corn) | $191 | 1,126,990,585 | $61.2 (Mainland China) |
| Wheat | $168 | 748,392,150 | $50.7 (Mainland China) |
| Soybeans | $107 | 335,613,801 | $40.7 (United States) |
| Eggs, hen, in shell | $93.6 | 74,180,272 | $26.1 (Mainland China) |
| Potatoes | $92.7 | 356,952,488 | $32.2 (Mainland China) |
| Vegetables, not elsewhere specified | $89.1 | 292,920,885 | $53.6 (Mainland China) |
| Tomatoes | $87.9 | 178,158,747 | $28.9 (Mainland China) |
| Sugarcane | $87.3 | 1,874,611,396 | $40.9 (Brazil) |
| Grapes | $67.8 | 74,089,693 | $14.4 (France) |
| Seed cotton | $56.7 | 67,622,193 | $21.4 (Mainland China) |
| Buffalo milk, whole fresh | $56.4 | 115,204,379 | $43.1 (India) |
| Cotton lint | $50.5 | 23,274,797 | $18.6 (Mainland China) |
| Apples | $45.9 | 84,743,988 | $20.8 (Mainland China) |
| Onions, dry | $42.1 | 94,838,690 | $23.9 (Mainland China) |
| Sheep, meat | $40.4 | 9,567,978 | $13.8 (Mainland China) |
| Cucumbers and gherkins | $40.2 | 79,844,838 | $29.6 (Mainland China) |
| Garlic | $39.3 | 26,821,718 | $31.5 (Mainland China) |
| Bananas | $38.5 | 112,627,980 | $8.13 (India) |
| Goat, meat | $36.4 | 5,794,581 | $25.3 (Mainland China) |
| Oil palm fruit | $35.7 | 255,567,218 | $17.7 (Indonesia) |
| Cassava (yuca) | $34.3 | 288,497,460 | $4.11 (Indonesia) |
| Palm oil | $34 | 58,156,889 | $16.2 (Indonesia) |
| Watermelons | $33.9 | 102,414,316 | $26.1 (Mainland China) |
| Rapeseed | $31.7 | 68,113,132 | $10.4 (Mainland China) |
| Mangos, mangosteens, guavas | $30.0 | 49,523,191 | $14.1 (India) |
| Eggs, other bird, in shell | $27.9 | 6,108,690 | $25.6 (Mainland China) |
| Groundnuts, with shell | $26.9 | 44,543,757 | $16.1 (Mainland China) |
| Chilis and peppers, green | $26.3 | 34,567,250 | $9.95 (Mainland China) |
| Sweet potatoes | $26.1 | 89,985,845 | $17.8 (Mainland China) |
| Barley | $22.9 | 145,906,773 | $2.08 (Russia) |
| Oranges | $22.6 | 72,771,146 | $5.62 (India) |
| Eggplants (aubergines) | $21.6 | 51,302,856 | $16.8 (Mainland China) |
| Olives | $19.9 | 19,650,821 | $5.5 (Greece) |
| Sunflower seeds | $19.4 | 47,401,997 | $4.54 (Ukraine) |
| Tangerines, mandarins, clementines, satsumas | $19.1 | 32,304,732 | $12.2 (Mainland China) |
| Cabbages and other brassicas | $19.1 | 69,790,058 | $9.3 (Mainland China) |
| Spinach | $18 | 26,763,044 | $15.4 (Mainland China) |
| Strawberries | $17.7 | 7,901,882 | $6.49 (Mainland China) |
| Peaches, nectarines | $17.1 | 24,040,295 | $9.98 (Mainland China) |
| Tobacco, unmanufactured | $16.2 | 6,361,725 | $8.27 (Mainland China) |
| Coffee, green | $16.1 | 9,353,937 | $6.75 (Brazil) |
| Lettuce, chicory | $15.7 | 27,440,987 | $8.33 (Mainland China) |
| Rubber, natural | $15.3 | 13,449,190 | $6.19 (Thailand) |
| Tea | $15.2 | 5,859,841 | $11.3 (Mainland China) |
| Peas, green | $14.7 | 19,854,943 | $9.68 (Mainland China) |