This is the talk page for discussing improvements to the Greenhouse effect article. This is not a forum for general discussion of the article's subject.
This article is within the scope of WikiProject Climate change, a collaborative effort to improve the coverage of Climate change on Wikipedia. If you would like to participate, please visit the project page, where you can join the discussion and see a list of open tasks.Climate changeWikipedia:WikiProject Climate changeTemplate:WikiProject Climate changeClimate change articles
This article is within the scope of WikiProject Weather, which collaborates on weather and related subjects on Wikipedia. To participate, help improve this article or visit the project page for details.
This article is written in American English, which has its own spelling conventions (color, defense, traveled) and some terms that are used in it may be different or absent from other varieties of English. According to the relevant style guide, this should not be changed without broad consensus.
This article was the subject of a Wiki Education Foundation-supported course assignment, between 18 January 2022 and 13 May 2022. Further details are available on the course page. Student editor(s): Hyogase, Yuheng98, Dongchen Li (article contribs).
Wiki Education assignment: Applied Plant Ecology Winter 2022[edit]
This article was the subject of a Wiki Education Foundation-supported course assignment, between 10 January 2022 and 23 April 2022. Further details are available on the course page. Student editor(s): Christina2506 (article contribs).
Brown University EEPS1960X course assignment[edit]
This article is or was the subject of a class project aimed at updating IPCC references to the most recent report (AR6). More details can be found on the course page. Student editor(s): JF726. Updates will be made according to the IPCC citation guide.
New graphic "Earth Energy Budget with GHE.svg"[edit]
Note Rhwentworth replaced the second graphic in the lead with a new energy flow diagram. A few critiques here that are stylistic, I don't have time for a data review right now:
Capitalization is currently inconsistent in the graphic (eg "Sunlight absorbed by Ocean & Land"). Please use sentence case for all labels.
I'm not sure what "Greenhouse Effect (thermal radiation not reaching space)" is meant to signify vs "Cancelling Exchange of Thermal Radiation (no heat transferred)"
It says "Greenhouse gases & clouds absorb & emit thermal radiation" in one place and "Greenhouse gases & clouds emit thermal radiation" in another place, and in neither place is the text labeling anything. One cut definitely, both cut maybe (since not a label, this text can be in the caption).
Fonts are still too small for thumbnail and smartphone. Wording needs to be cut or simplified so all fonts can be bumped. I would suggest trying to remove parenthetical text everywhere.
The "Net Absorbed" bit is, I assume, climate change. Would probably be good to clarify that and add precision to the number if possible.
Though the new diagram shows a lot of work, I agree about the font size (discussed in previous years at Talk:Climate change). Also, I think the previous diagram File:Greenhouse Effect.svg had more readily understandable graphics—critical for a lay-audience encyclopedia, especially in the lead. I especially liked the earlier diagram's circular arrows in the lower right quadrant, which immediately and intuitively captures the greenhouse effect. Its color scheme was less bland, more demonstrative. I understand that the numbers should be updated; maybe the new chart can be improved in clarity, but I'm favoring the old diagram in presentation. —RCraig09 (talk) 17:05, 29 April 2023 (UTC)Reply[reply]
I've done some additional enlarging of fonts (though I don't know if that greatly changes matters), switched to mainly lowercase, made the colors bolder, and added some circular arrows as in the prior diagram. I can read the current version of the diagram on my smartphone; I've got a small phone and imperfect vision.
I don't think it's a reasonable expectation that all text should be easily readable in a thumbnail. If you're going to hold to that as a standard, why bother with full-size figures? The expectation would preclude being able to convey detailed or complex information in a graphic. In the case of the current figure, I think cutting text would increase readability at the expense of reducing the chances of the figure being understood. I don't like that tradeoff.
I believe that the level of detail included in the figure needs to be present somewhere in the greenhouse effect article. If you think it's too much for the lead-in, then maybe it could be shifted further into the article, with a simpler graphic offered in the lead-in.
However, I'm not enthusiastic about restoring the prior figure as the simpler graphic for the lead-in. While the numbers in that figure are out-dated, my much larger concern is that it identifies the greenhouse effect as being what happens at the surface rather (where downwelling longwave radiation is measured) rather than as being a phenomena that occurs between the surface and top-of-atmosphere (TOA). While the greenhouse effect, broadly defined, has effects in both places, there are a lot of reasons to favor that latter focus:
The quantitative values for GHE as used by the IPCC and in much of the technical literature are defined in therms of the comparison between TOO and surface upwelling longwave flux values.
"Radiative forcing" due to increasing greenhouse gas concentration s a change to the TOA-surface difference, not a value that corresponds to what happens to downwelling radiation fluxes at the surface.
The overall significance of the GHE is relatively simple and clear (and ultimately compelling) when one focuses on the surface-TOA comparison. The significance of changes in the rate of downwelling thermal radiation at the surface is so complicated to unravel that it's unlikely to be a rewarding venture (and it leaves a lot of room for doubt about the overall implications for planetary warming). The complexity difference arises because evaporation and convection can substitute for radiative heat transport at the surface (to some extent), and it's not easy to sort out to what extent they will do so. In contrast, when one looks at thermal emissions at TOA, the role of convection greatly decreases, simplifying the analysis. That's why most technical work on the GHE focuses on TOA.
In my conversations with people who deny the greenhouse effect, I've found that when the focus is on what happens at the surface, the conversation nearly always devolves into an intractable mess of misunderstandings and faulty logic. When the focus is on the comparison of longwave fluxes at TOA and at the surface, it may not be easy going, but the arguments in favor the the GHE causing warming are much more solid and hard to deny.
I have a sense that, in recent decades, scientists and leading science communicators have been trying to shift towards a focus on the TOA-surface comparison. Unfortunately, many people haven't gotten the message and still focus on what happens at the surface. I think that's detrimental to full public understanding and acceptance.
For those many reasons, I feel concerned about any presentation that implies what happens with downwelling longwave radiation at the surface) "IS the GHE," without acknowledging that the GHE is more rigorously defined as what happens between the surface and TOA.
Responding to questions:
The data used in the figure comes straight out of the 2021 IPCC AR6 WG1 report, p. 934.
"Greenhouse Effect (thermal radiation not reaching space)" is the difference between what is emitted by the surface (398 W/m2) and what reaches space (239 W/m2), i.e., 159 W/m2; this is the TOA-surface comparison mentioned above, as the the quantitative definition of the GHE.
"Cancelling Exchange of Thermal Radiation (no heat transferred)" refers the 342 W/m2 of downwelling longwave radiation at the surface, which effectively "cancels" an equal amount of surface emissions, reducing 398 W/m2 of potential radiative heat loss to only 56 W/m2 of radiative heat loss; this is the rats-nest focusing-on-the-surface version of the GHE.
The text "greenhouse gases & clouds absorb & emit thermal radiation" is placed at the point of origin of the downwelling thermal radiation headed for the surface, and is intended to help explain how and why there is a cancelling exchange of thermal radiation happening at the surface. It's an expanded version of the text "greenhouse gases" which appears in this diagram. The text "greenhouse gases & clouds emit thermal radiation" is placed next to where "outgoing thermal radiation" is exiting the atmosphere, to explain how that radiation originates.
"Net absorbed" is, yes, the energy balance that corresponds to climate change happening. I used the value 1 W/m2 to be consistent with the level of accuracy in the rest of the diagram. It's difficult to be any more accurate than that. Here is a chart of TOA energy imbalance that I plotted using NASA CERES data. As you can see, the value fluctuates over a range of maybe ±0.4 W/m2. Using ~1 W/m2 is a pretty good estimate corresponding to the period around 2015 when the rest of the data was taken, though the value has recently gotten up to around 1.7 W/m2. Clarifying the significance of this number isn't something that it makes sense to do within the diagram, but could potentially be done somewhere in the greenhouse effect article.
Thoughts?
Should I think about whether there is a way of making a simpler diagram for the lead-in, to support moving the fuller diagram further into the article? While I agree that the prior diagram was more easily understood, I think that it also more easily promoted misunderstandings. Rhwentworth (talk) 03:31, 30 April 2023 (UTC)Reply[reply]
Earth Energy Budget with GHE.svg
Greenhouse Effect.svg
Thank you for all the time you are spending on this issue. Graphically, I think there is some confusion/distraction in your having some wide arrows (triangles, actually) versus narrower arrows (like the circulating green arrows). The earlier image was much simpler. Specifics:
— I'm having trouble understanding the meaning of the green trapezoid with "159", which is especially important since it's labeled "greenhouse effect" and it's not clear whether or not the sloped bottom side is intended as an arrow.
— The circular green arrows (circulating "342") would seem more accurate if they descended into the brown "ocean and land", with the red area "398" being above the "ocean and land" rather than beneath the surface of "ocean and land".
– Normally a caption would clarify a complex diagram, but here, the caption recites several technical terms that aren't even in the diagram.
These are my initial impressions. It's just that I (an engineer) don't quite understand the new diagram myself, and think the average layman would have problems also. I'm sorry I express problems rather than solutions, but I do think it's important to present a lead that Marjorie Taylor Greene voters will be able to understand the GHE (if they were to try). —RCraig09 (talk) 05:13, 30 April 2023 (UTC)Reply[reply]
Responding to specifics:
"I do think it's important to present a lead that Marjorie Taylor Greene voters will be able to understand the GHE (if they were to try)" — I too want to present things in a way that is as simple, clear, and compelling as possible. It's just that I have the experience that, any time someone presents the GHE in a way that is oversimplified to the point of saying something that seems simple and makes sense to those who are sympathetic, but is technically not-quite-right or prone to being misinterpreted, it has horrific consequences with those predisposed to disbelief. That sort of content ends up being the primary supporting evidence for "proofs" that the GHE is "nonsense." So, the challenge is to find ways of expressing things that are as simple as possible, but are ultimately rigorous enough that they don't cause trouble when people try to drill down into the details. There's no easy recipe for this; I'm still working on identifying adequate presentation approaches.
"Graphically, I think there is some confusion/distraction in your having some wide arrows (triangles, actually) versus narrower arrows (like the circulating green arrows)." — Hmm... the two diagrams seem to me to be very similar in that regard. In both, the wide arrows represent the amount of power in each energy flow, and the circulating green arrows are basically an annotation calling attention to the way that there is a re-circulating pattern in those wide-arrow energy flows. The differences I see are that (a) the old diagram used arrow heads wider than the main flow, and my diagram uses arrowheads (triangles) the same width as the energy flows; and (b) the flows are wider in my diagram than they are in the older diagram because of the need to represent a flow (the radiant heat transfer from the surface to the atmosphere) which is only about 14 W/m2, where the smallest flow shown in the original diagram was 40 W/m2. (It's important for the line widths to be to scale, so that one can accurately compare how the widths of various flows add up.) What's the difference you're seeing? Until I understand, I don't know how to suggest a fix.
"it's not clear whether or not the sloped bottom side is intended as an arrow" — No, it's not. The sloped bottom was simply intended to offer a uniform gap relative to the arrow-head below. I could consider using a straight across bottom for the green region, if that might be clearer?
' I'm having trouble understanding the meaning of the green trapezoid with "159", which is especially important since it's labeled "greenhouse effect" ' — It's not an energy flow, but the absence of an energy flow. If you look at the top of the diagram, if the atmosphere was transparent to thermal radiation (i.e., if there were no greenhouse gasses), then the amount of radiation reaching space would be the same as what leaves the surface, i.e., 398 W/m2. But, with greenhouse gases present, the amount of radiation reaching space is 239 W/m2. So, because of greenhouse gases (GHGs) and clouds),159 W/m2 of thermal radiation is NOT reaching space, and not cooling the Earth. That 159 W/m2 of radiation that is not reaching space (but would if GHGs and clouds were absent) is what scientists technically refer to as the GHE. That's what the green box is trying to show. As to why that 159 W/m2 is important... It's important to understand that the amount of radiation going to space is more or less fixed -- over the long run, it will always nearly equal the amount of energy coming in. The GHE is) the phenomenon whereby GHGs and clouds allow the thermal radiation emitted by the surface to be larger than the thermal radiation emitted to space. That's important because the thermal radiation emitted by the surface is closely related to the surface temperature (specifically, it's proportional to T4). So, the GHE represents, quantitatively, how much warmer the surface is than in would be in the absence of GHGs etc. One needs to think it through. It's not immediately intuitive, but it makes sense and is very clear to those who see it. And, it's how scientists define the GHE. (They just rarely spell it out in ways that people "get.")
' The circular green arrows (circulating "342") would seem more accurate if they descended into the brown "ocean and land", with the red area "398" being above the "ocean and land" rather than beneath the surface of "ocean and land".' — I guess I could imagine moving the red "398" area up; perhaps that would make more sense. As for the thin green arrow... that's not an energy flow, just something that's trying to point out the existence of a loop in the big arrows. But, there may be a clearer way to show that. Let me think about it...
"Normally a caption would clarify a complex diagram, but here, the caption recites several technical terms that aren't even in the diagram." — We could consider what to put in the caption as a separate issue. It's not clear what would be best to focus on. The diagram does offer links to a rather long "description," which addresses some issues.
I don't think any one diagram like this is, by itself, likely to be able to bring people to a point of understanding. To do that would likely take a number of diagrams, plus suitable text. Rhwentworth (talk) 07:30, 30 April 2023 (UTC)Reply[reply]
FYI, my latest iteration of the diagram is here. (I'm thinking of trying different colors before I upload it to Wikipedia Commons.) Rhwentworth (talk) 00:31, 1 May 2023 (UTC)Reply[reply]
— I can see you're spending a huge amount of time. Unfortunately I don't think minor changes will change the resultant impression or end effect on lay readers. The length you have taken (above) to explain certain diagram elements to me, suggests that the diagram is not as self-evident (directly illuminating) as it should be.
— A possible solution is, for yourself, to take a few moments to informally draw on paper (not a full-blown SVG) a diagram that has the absolute minimum number of concepts/entities (as nodes), and the absolute minimum number of connections/arrows (as links). That drawing could be the basis of a concise diagram. Your approach so far has many elements that aren't needed (example: the tan pathway going through the brown ocean-and-land zone). The earlier diagram's approach makes more efficient use of graphic elements. In your quest to be exhaustively complete, you're leaving behind almost all readers. I understand what you say, that one diagram will not bring people to the point of understanding, but I think File:Greenhouse Effect.svg captures the essence.
I've focused on the enhanced "Earth's Energy Budget" diagram because I think it's a diagram that's needed. I'm not wedded to it being in the lead-in. I agree that it's not amenable to being understood at a glance (nor is any sophisticated understanding of the GHE that quickly developed).
It makes sense that you'd like something simpler, that gets to the bare essentials, in the lead-in.
So... I've developed a diagram which, to me, illustrates the essentials of the GHE. This diagram compares the situation with and without the GHE. A draft of that diagram is available HERE. (I haven't uploaded it to Wikipedia Commons yet, in case there are change requests.)
— My initial impression is that the left half of the diagram should be omitted (no use confusing peeps with a situation that doesn't apply to Earth, in a diagram that's twice as large as it needs to be). Similarly, on the right side, the Green "158" represents something that doesn't "exist" where it's drawn; maybe a sideways arrow into/within the atmosphere would be less confusing. The red "thermal radiation" path seems to by-pass the atmosphere, when the opposite concept is intended. The four temperatures T=__ are baffling. Graphically, the rounded rectangles that surround text add visual complexity and could be eliminated altogether if other elements were planned properly. The separation of space-atmosphere-ocean/land into separate rectangles makes them seem like separate elements when in fact they're contiguous; they add visual complexity distinct from the white background. On a more minor note, the "absorbed sunlight" seems like it should be at Earth's surface.
I get that you like simplicity of File:Greenhouse Effect.svg (and perhaps the aesthetics?) Unfortunately, to me, that figure verges on being unintentional disinformation. I've long been thinking the article would be better off without it, even if there was no other figure to replace it. It promotes ideas that, in my experience, contribute to greenhouse-effect-denial. I really, really dislike that figure. If the topic of the greenhouse effect hadn't become a polarizing issue, that illustration would be innocent enough, and I'd find it tolerable even if it's not ideal. But, in a world where people are actively promoting denial of the GHE, figures like that one make the situation much worse.
I imagine it's likely frustrating to hear preferences that are so different from your own. It's certainly tricky to collegially sort through this editorial process.
To address issues that you've raised:
It seems clear that you don't yet understand the ideas that the diagram is trying to convey? Do you think it might make sense to get to a point of understanding what the ideas are that the diagram is trying to convey, before suggesting major structural changes? Otherwise, I think there is a tendency to suggest changes that can detract from the illustration being effective in making the points it is trying to make.
The suggestion to remove the left-hand sub-figure is the main case in point, in that regard. I believe that comparing the two figures creates the possibility of the viewer figuring out the significance of the GHE. If only the right-hand sub-figure was included, I suspect that outcome is highly unlikely.
I haven't yet offered a caption to contextualize the figures. Here's a first draft of a caption: "In the greenhouse effect, the presence of an atmosphere than can absorb and emit thermal radiation permits and ensures that the amount of thermal radiation emitted by the surface is larger than the amount that reaches space, which is in balance with incoming energy. Since the amount of thermal radiation emitted by the surface is directly related to the surface temperature (by Planck's Law), this means that an atmosphere which is not transparent to thermal radiation makes the surface warmer."
Note that I could put the two sub-figures one above the other, instead of side-by-side, if that would be any better.
The green "158" is supposed to make visually display what would get through the atmosphere if the atmosphere was transparent. Perhaps I could somehow make the block look more like the "ghost" of radiation that doesn't in fact get through? I'm trying to convey visually that 240+158=398. Pointing an arrow at the atmosphere couldn't convey that. The definition of the GHE, as used by scientists, is NOT something that happens in one place. It's a comparison between what happens in two different places, ie., top-of-atmosphere vs. the surface. That comparison (which is what the GHE value fundamentally is) can't accurately be conveyed by pointing into the atmosphere. (What would you imagine pointing at? What would you imagine the arrow saying?)
'The red "thermal radiation" path seems to by-pass the atmosphere, when the opposite concept is intended.' I'd like to understand what you're saying. The intention is that the "thermal radiation" path in the "No GHE" diagram on the left essentially by-passes the atmosphere; while the red path on the right is supposed to indicate the radiation going into the atmosphere, being absorbed, and then some coming out the top of the atmosphere. Is that what you're saying looks to you like "by-passing"? I suppose I could show the flux of radiation through the atmosphere reducing with altitude... Would that be clearer to you?
"The four temperatures T=__ are baffling." Basically, there is a simple relationship between the amount of thermal radiation emitted by the surface and the surface temperature. Given one, you can calculate the other (via Planck's law). That simple relationship is the whole reason why we care about surface emissions and about the difference between surface emissions and outgoing emissions, i.e., why we care about the numerical value of the GHE. I've modified the diagram to explicitly include the relationship. Does that help?
"Graphically, the rounded rectangles that surround text add visual complexity and could be eliminated altogether if other elements were planned properly." The rounded rectangles are present because, in order to comply with the request for large fonts, the text often doesn't fit within the area that is being referred to; using the text boxes was intended to help make that work. That was a more severe problem in the other, more complex diagram. I suppose I could see how it looks if I do without those boxes, or increase their transparency. I don't have must idea what you might have in mind with regard to things being "properly planned." If it were just me, I'd use smaller fonts, and that would allow things to fit. But, if I can't reduce the fonts, I'm not sure what else to do. Suggestions?
"The separation of space-atmosphere-ocean/land into separate rectangles makes them seem like separate elements when in fact they're contiguous" Yes, they are contiguous in reality. However, the numbers and most explanations refer to what happens in the transition between these different realms. In the more complex diagram, I think it's clarifying to draw attention to that -- that the diagram is really only about those transitions, not about what happens inside the atmosphere. For this diagram... hmmm... let me think about it.
'On a more minor note, the "absorbed sunlight" seems like it should be at Earth's surface.' Well, I'm sort of finessing that... in reality, much of the absorption happens in the atmosphere; only 160 W/m2 is absorbed at the surface. The logic of the diagram actually works regardless of where the sunlight is absorbed--but the reasons that works are subtle and I'd rather not raise unnecessary questions about that.
Anyway, thanks for the feedback. I'll likely do some more revisions tomorrow. I do have ideas about how I might try to address some of the issues you've raised. Rhwentworth (talk) 07:50, 1 May 2023 (UTC)Reply[reply]
I don't think our substantive preferences differ from each other. I can appreciate the technical distinctions between old and proposed diagram. Most of my concerns are for making the basic GHE concept simple and direct enough for Marjorie voters to quickly understand: (a) simplicity/conciseness in content, and (b) graphical simplicity. Simplicity in content argues against including formulas and temperatures in the diagram itself (though I think the flux numbers are good to retain). And graphical simplicity means to include the absolutely minimal number of graphical elements, which argues against the rounded rectangles behind text. A specific graphical simplification would be to place a "shield" (or similar) in the atmosphere that blocked some thermal radiation, avoiding the need for a perplexing "phantom" blue block that would require outside-the-diagram explanation. Beneath the shield could be a small starburst-like symbol that symbolizes the distribution of heat into the atmosphere but not escaping into space. The red 298-to-340 path would be to the left of the "shield" and be in front of the blue atmosphere rather than behind it. A few years ago, User:Efbrazil and I discussed possible improvements to File:Greenhouse Effect.svg but couldn't arrive at a definitive improvement. — 16:40, 1 May 2023 (UTC) —RCraig09 (talk) 20:18, 1 May 2023 (UTC)Reply[reply]
Efbrazil, are you tracking that I've produced two different diagrams? We are now discussing the diagram TOASurfaceGHE which is simpler and does not have "squinty" text.
My more complex first diagram is still undergoing additional refinement. It serves a different function, which I agree is less suited to the lead-in. The NASA poster has its uses -- and, it's widely misunderstood by climate skeptics. My version of that diagram is intended to share similar information in a way that points out the GHE more explicitly and combats certain prevalent misunderstandings. I'm still tweaking its presentation aesthetics. Rhwentworth (talk) 00:02, 2 May 2023 (UTC)Reply[reply]
A bit of background on creating images for wikipedia:
The best images have the least amount of text, ideally none at all, but some as necessary for things like graphs where labels are needed
Images with text should be svg so that they can be localized
The majority of our users are on smartphone and only a tiny fraction of thumbnail images get clicked on. The best practice is to embed the graphic in a page and try to get the text to match the size of the wiki text already on the page.
I've produced a new version of the with-and-without-GHE graphic that I hope will address your concerns. See TOASurfaceGHE. I think that wrestling with your (RCraig09) feedback has led to considerable improvement. Thoughts? Rhwentworth (talk) 23:47, 1 May 2023 (UTC)Reply[reply]
I think that https://climatepuzzles.org/toasurfaceghe/ is simpler graphically, but substantively confusing even to a geek like me. Besides being twice as wide as necessary to show what the GHE is (on the right, versus what GHE is NOT, on the left), the diagram on the right doesn't convey that heat is retained in lower atmosphere since the four "T" temperature values imply that it's hotter near space than near Earth's surface! Generally, a cardinal rule of graphics is to show things graphically to the extent possible, and avoid textual "explanations", especially "higher temperature achieves ... energy in = energy out" which is utterly confusing commentary. Also "atmosphere impedes thermal radiation" is techy jargon and shouldn't be below the sunbeam in any event. Again I urge making small changes to File:Greenhouse Effect.svg. —RCraig09 (talk) 04:38, 2 May 2023 (UTC)Reply[reply]
Tomorrow I'll take another crack at https://climatepuzzles.org/toasurfaceghe/ Some parts of your feedback I may be able to address; others... I don't yet see a way...
What do you think the greenhouse effect is? How do you think it works? If you're as confused as you seem to be by https://climatepuzzles.org/toasurfaceghe/, that leads me to wonder if there is some major conceptual disconnect going on here.
The basics of the GHE aren't rocket science. The problem is not my understanding of the science. The goal is immediately and intuitively communicating basic concepts to a lay audience, which must involve the simplest graphical elements possible and ~zero jargon/techy legends. The discussed diagrams have made only minor progress toward that goal. I may do a hand drawing of a possible improvement over File:Greenhouse Effect.svg, hopefully within a day. —RCraig09 (talk) 17:10, 2 May 2023 (UTC)Reply[reply]
Alternative draft diagram
► I've uploaded a rough draft, downloadable from Google Drive here(corrected to this) assuming you have a Google account. It makes use of your sloped-side trapezoid concept. Of course, colors and exact wording etc. are preliminary, and I'm fine if you want to add the W/m^2 numbers, though the Temperature numbers(also, the top numbers seem inconsistent) are so techy as to be out of scope for an overview diagram. I know there are other processes and concepts going on in parallel with those in this rough drawing, but it captures the essence. Share your thoughts, User:Rhwentworth and User:Efbrazilet al.
► The crux underlying this entire discussion is that the greenhouse "effect" doesn't occur in one region (lower atmosphere only, or upper atmosphere only, etc). I removed any such limitation, and merely place a main title at the top (which indicates the drawing as a whole).
We'll need permissions adjusted to be able to access you Google Drive document; I sent an access request, but you might just want to make it viewable by anyone with the link.
Here are the latest versions of my With&WithoutGHE and energy budget diagrams. The former includes a number of changes to address your concerns. (There are still numbers present, including temperatures. In what way do the numbers seem "inconsistent"?)
— D'oh! Here's the "general access" link: click. Caveat: I purposely try to convey only the basics of greenhouse gases, not numerous other energy flows occurring in parallel.
— 16C=61F (make sense), but 34C!=63F (inconsistency). —RCraig09 (talk) 03:57, 3 May 2023 (UTC)Reply[reply]
More exact numbers are 240 W/m2 ~ -18.08℃ / -0.55℉ and 398 W/m2 ~ 16.30℃ / 61.34℉. Changes are 34.38℃ / 61.89℉. If you round those to whole numbers, you get the numbers I used: 34℃ / 62℉. (Didn't use 63 in any version I can find.) So, it's just that rounding sometimes produces slightly unexpected results. Rhwentworth (talk) 04:35, 3 May 2023 (UTC)Reply[reply]
The left-pointing arrows represent how thermal radiation is converted to "heat" (labeled in the atmosphere), reducing the amount of thermal radiation (narrowing orange trapezoid) that reaches space. The diagram focuses on "Effects of greenhouse gases" and not numerous other energy inflows/outflows that make diagrams klugey. (Minor: Now I'm thinking the arrows should "begin" in the middle of the pink triangle rather than from the pink-orange border.) —05:07, 3 May 2023 (UTC) _ _ _ _ The W/m^2 numbers can be added because they're probably not "too" techy, and they explain the different widths of the different pathways. 05:11, 3 May 2023 (UTC) _ _ _ _ Or maybe "captured heat" or "trapped heat" could be added inside the pink triangle. —RCraig09 (talk) 05:13, 3 May 2023 (UTC)Reply[reply]
Thanks for the clarification. Unfortunately, it's not true that 'thermal radiation is converted to "heat"... reducing the amount of thermal radiation ... that reaches space.' That idea seems to follow the widespread (but incorrect) trope of thinking that absorbed thermal radiation "warms" the air, raising its temperature.
In the troposphere, GHGs nearly always emit more thermal radiation than they absorb. So, the net direct effect of greenhouse gases (GHGs) is to cool the air, reducing its temperature. There is typically no radiative heat transfer into the air associated with GHGs. (I've got a chart from a text book that clearly illustrates this; see Fig. 3.18 in Global Physical Climatology by Hartmann.) Water vapor has a massive radiative cooling effect on the troposphere, and CO2 has a moderate cooling effect there.
So, the longwave radiative effects of GHGs drain heat from air; they don't add heat to the air.
So, if energy isn't getting extracted from upwelling longwave radiation to heat the air, why does the upwelling flux decrease with altitude?
Most thermal radiation with wavelengths outside the atmospheric "window" is absorbed at a fairly low altitude. At every altitude there is an upward flux and a downward flux, both of which are mostly determined by the temperature profile in the vicinity of that altitude. (The higher the concentration of GHGs, the smaller that "vicinity" is. Also, the higher the concentration, the closer the values of the upward and downward fluxes, and the smaller the radiative heat transfer, because the radiative heat flow rate is the difference of those two fluxes.)
Basically, this means that the fluxes of thermal radiation, both upward and downward, decrease with altitude because the temperature of the air decreases with altitude.
THAT is why the upwards thermal radiation flux in the diagram has a wedge shape, decreasing with altitude.
# # #
In view of that, I don't think your idea about what to depict in the diagram makes sense.
If we wanted to reference the real mechanism, we'd have to somehow connect the shape of the upward-thermal-radiation wedge to the temperature profile of the atmosphere. Though, we'd also need to somehow explain it in a way that is consistent with there being not "wedge" behavior in the absence of GHGs.
# # #
The heat isn't really "captured" or "trapped" in the wedge in any meaningful way. It's trapped below, at the surface, and can't travel upward because radiative heat transfer is being "impeded" or "inhibited" or "constricted" or "reduced" or something like that.
ADDED: I've got an idea... basically, their is an "effective emission altitude", and roughly, upward thermal radiation intensity matches temperature below that level, and then simply goes upward unimpeded above that level without further reductions, since the air is transparent above that level. I think that could be depicted...Rhwentworth (talk) 06:57, 3 May 2023 (UTC)Reply[reply]
Ok, here's a new graphic inspired by my response to your draft: GHETempProfile.png I imagine it has more words and numbers than you'd prefer. But, I hope it's clearly conveying some key ideas. Thoughts? Rhwentworth (talk) 10:21, 3 May 2023 (UTC)Reply[reply]
My understanding is that there is a diminishing greenhouse effect in the upper atmosphere due to density of air and concentration of thermal radiation, meaning Craig's linear graphic with a magic space cutoff line and Rhwentworth's linear graphic with a magic temperature cutoff are both incorrect. Both graphics are unsourced as well, and graphics showing data like this must start with a source.
Making up novel graphics in general is counterproductive and can easily violate WP:NOR. What I suggest is finding a graphic in a major source that is making the point you want to make. We can then agree the graphic is a good one and then it can be adapted for smartphone / thumbnail view. That's how the most successful graphics have been built. The sourcing for the graphic is simple and represents consensus science that way. Efbrazil (talk) 17:13, 3 May 2023 (UTC)Reply[reply]
~ scratches head re step-by-step cause-and-effect ~ I've puzzled over your (Rhwentworth) explanation and the ...Climatology Fig. 3.18 (here), but I'm having trouble comprehending the cause-and-effect of GHGs versus heat and temperature: I'm not arguing, but conceptually they seem to be chasing each other in a circle. Is it accurate to say that at each altitude below the "effective emission height" (huh?), more heat is radiated downward than upward, thus trapping heat below—or is that a misunderstanding? Separately: If as the diagram says, thermal radiation intensity tracks temperature-which decreases with altitude-why would increasing human-caused GHGs increase temperature? In any event, I don't think your new diagram suggests, graphically, how temperatures would increase with increasing GHG concentrations: the "GHE" seems to mysteriously appear localized at the top while the GHGs are obliquely suggested near the bottom. Understanding your chart requires a boatload of comprehension that lies outside the diagram itself, and beyond the reach of Marjorie voters. I'm not asking for more long explanations (which would take a lot of your time), but I think that any chart must intrinsically show the cause-and-effect of GHGs and heat/temperature, and I (and apparently all Wikipedians to date) am not knowledgeable to even attempt that. —RCraig09 (talk) 21:57, 3 May 2023 (UTC)Reply[reply]
User:Efbrazil I agree about sourcing, and Googling "greenhouse effect" and looking at the images yields most images in line with the old File:Greenhouse Effect.svg and my own Version 1. Which graphic were you referring to when you wrote "The sourcing for the graphic is simple" ? —RCraig09 (talk) 21:57, 3 May 2023 (UTC)Reply[reply]
User:RCraig09 When I said "The sourcing for the graphic is simple..." I meant if you are adapting a graphic from a place like NASA or the IPCC you can easily defend it by pointing towards the source graphic. That makes it clear that your simplification or rendering of the data is clearly not WP:OR.
Regarding your hand drawn greenhouse effect image, I think it is oversimplified to the point of being incorrect as it makes it look like the greenhouse effect is constant up until getting to space. About half of the mass of the atmosphere is below about 3 miles in altitude, so I expect about half of the greenhouse effect takes place in those 3 miles of air. It may be more or less depending on other factors, but that's my guess. Space is generally accepted to be about 60 miles up, so the effect would asymptotically decay up to that point. Or maybe the layers of the atmosphere and differing temperatures mean that the decay would not be a smooth graph. The point is I don't know really, but it isn't linear, and I'd want to see real data before we have a graphic that proclaims how the greenhouse effect operates at different altitudes. Efbrazil (talk) 23:18, 3 May 2023 (UTC)Reply[reply]
@Efbrazil: In fact I was thinking of doing a slowly-changing gradient color going upward (unifying Atmosphere and Space); and also something like an asymptotic curve but opted for a straight line for simplicity (to avoid the implication that my asymptotic curve is quantitatively accurate). I'm noticing that limiting Google image searches to NASA or IPCC yields drawings in line with File:Greenhouse Effect.svg and File:Climate Change Schematic.svg and I'm wondering if we're all chasing a goal—being technically accurate to a tiny level of detail but conceptually and visually simple—that's impossible to achieve. I remember that you and I tried a few years ago... and we let it go! —RCraig09 (talk) 03:10, 4 May 2023 (UTC)Reply[reply]
The top graphic on the greenhouse effect page is where that ultimately led to, so it wasn't a waste! But yeah, where we started vs where we ended up were 2 totally different places (see change history of the graphic). The starting point was a novel idea, and the final graphic is an adaptation of educational materials you can find all over the Web. Efbrazil (talk) 17:53, 4 May 2023 (UTC)Reply[reply]
Yes, of course any illustration we put into the article will need to be sufficiently closely tied to the work of reputable sources that there isn’t a question of WP:OR.
My draft illustration GHETempProfile.png is close to other figures I’ve seen in some respects. Mostly, it’s a simple match to graphs involving temperature and “effective emission height” that are widely used in explanations of the GHE. But, there is one aspect of it for which I’d need to find a solid reference for before I’d propose use of the illustration in Wikipedia.
ABOUT “magic temperature cutoff”
Efbrazil wrote “… Rhwentworth's linear graphic with a magic temperature cutoff [is]incorrect.”
It’s not at all “incorrect”, though it’s oversimplified. There is a well-defined “emission height” for each wavelength, but it varies by wavelength. See, for example, Fig. 3 in this article: https://geosci.uchicago.edu/~rtp1/papers/PhysTodayRT2011.pdf
However, a paper by R. Benestad argues that, for pedagogical purposes, it makes sense to talk terms of there being an effective emission altitude that summarizes what happens at all wavelengths. There is an figure that takes this approach in one of my climate textbooks. And here is an animated version of such a figure.
If that figure is going to stick around, would there be an objection to changing the word “reflect” to “redirect”? Reflection is a particular physical process, and what is being referred to has nothing to do with “reflection.”
It seems rather misleading that the figure shows no IR escaping, and instead shows it all being prevented from escaping.
Physicist Sabine Hossenfelder has a good video on the GHE. Around timestamp 1:50 she shows a similar figure, explains it, and then explains that it’s really not true, insofar as almost all IR is absorbed within a short distance of the ground in a manner very unlike what the illustration depicts. (She then proceeds to give a series of successively less-wrong explanations of the GHE.)
Although the figure cites references, those references don’t actually seem to provide much basis for the picture being presented in the figure. I see figures like it on the internet, but some of those seem to trace right back to Wikipedia as the ultimate source.
RCraig09 writes ‘Is it accurate to say that at each altitude below the "effective emission height" (huh?), more heat is radiated downward than upward, thus trapping heat below—or is that a misunderstanding?’
No. In the part of the atmosphere where it’s “optically thick” (meaning radiation is sure to be absorbed rather than escaping to space), the radiatively-transferred heat always flows along the temperature gradient, from warm to cool, generally from low to high, since air cools with altitude due to the adiabatic lapse rate. Since heat flow is the difference in the radiative fluxes in the two directions, that means the upward radiation flux is greater than the downward radiation flux (except possibly in the case of a temperature inversion).
The phrase “trapping heat” is pretty misleading. All it means is that the rate of upward radiative heat transfer is reduced to a low value. It’s analogous to the way insulation “traps” heat in a house during winter. Heat is still flowing out; it’s just that the rate of heat flow is reduced.
You can see that in my energy flow diagram that started this discussion. 398 W/ms² of heat would be leaving the surface as radiation, if it weren’t for greenhouse gasses and clouds. But, GHGs and clouds send back 342 W/ms² of thermal radiation (they radiate an equal amount upward). That effectively cancels out 342 W/ms² of upward radiation, leaving an upward radiative heat flow of only 56 W/ms². In other words, the presence of GHGs and clouds reduces the radiative heat flow away from the surface by a factor of 342/398 = 86%.
Evaporation and convection partially make up for that reduction in heat loss. But, still, the heat loss away from the surface is much smaller than it would otherwise be. That’s what it means when they say heat is being “trapped.”
RCraig09 continues “Separately: If as the diagram says, thermal radiation intensity tracks temperature-which decreases with altitude-why would increasing human-caused GHGs increase temperature?”
As GHGs increase, you need to go higher before the atmosphere becomes transparent. So, the emission height increases. The adiabatic lapse rate creates means that the air temperature changes with height by about 6℃/km. If the emission height gets raised by 1/6 km, then the whole lower atmosphere needs to get warmer by about 1℃ so that the temperature at the new emission height will be right to send the correct amount of radiation to space, to balance the incoming energy from the sun. It warms at the surface as well as at the emission height, because the lapse rate is (at least approximately) maintained. It’s illustrated in this animation.
RCraig09: “I don't think your new diagram suggests, graphically, how temperatures would increase with increasing GHG concentrations:”
I didn’t explain that before because I was just trying to explain the baseline “natural greenhouse effect”, not the “enhance greenhouse effect” that occurs when GHGs are increased.
It sometimes seems simplest to try to get people to understand the natural GHE before trying to explain the enhanced version, i.e., why increasing concentration changes things.
Note: it might be helpful to the video on the GHE by Physicist Sabine Hossenfelder.
RCraig09: “Understanding your chart requires a boatload of comprehension that lies outside the diagram itself… I think that any chart must intrinsically show the cause-and-effect of GHGs and heat/temperature”
The GHE simply isn’t simple enough that people can understand it at a glance with no explanation. I don’t think that’s a realistic expectation. Rhwentworth (talk) 06:26, 4 May 2023 (UTC)Reply[reply]
To address the issues with Climate Change Schematic.svg
I changed reflect to redirect as you suggest, that's a good change for correctness. Reflect was used as per other similar graphics online, but redirect is better wording.
It is showing how the greenhouse effect works, not the entire system. That is why no IR is shown escaping into space, and complications like clouds are left out. I enhanced the description of the graphic with more sources and explanation.
Obviously that graphic is the most simplified view of the greenhouse effect. It is meant to develop an intuitive understanding for everyone.
Re "It is showing how the greenhouse effect works, not the entire system. That is why no IR is shown escaping into space..." But, the GHE does involve IR escaping to space. 60% of the IR flux that leaves the surface exits to space. The fraction that doesn't reach space, 0.40, is the value of the normalized greenhouse effect. You've essentially drawn the GHE as having a value of 100%, a non-physical condition that would lead to an unending rise in temperature. For some viewers, see nothing escaping is likely to set off alarms of "something is wrong here."
If you wanted to depict some IR escaping, I could imagine a modification in which on some bounces a fraction of the energy escapes to space. Though, I suppose the discrete bounces you're depicting suggest you're thinking about the energy of one photon, which couldn't be split? Though, the track of the energy of one photon would look nothing like that, as the energy generally wouldn't be re-emitted in the same location as it was absorbed, since it would pass through a stage of being in the general pool of thermal energy. Sigh. There's probably no way of depicting things that isn't seriously misleading in multiple regards.
I get wanting to develop an intuitive understanding. I'm just nervous about whether we'll stimulate the right intuitions... Rhwentworth (talk) 21:59, 4 May 2023 (UTC)Reply[reply]
The latest copy of Earth Energy Budget with GHE.svg is getting better, but I still find it confusing. I'm adding it here again as a thumbnail at the largest allowable size for a lead graphic, to give you an idea of the fonts that most people will see.
In terms of substance, here's what confuses me:
It is still unclear to me why you have 342 and 159 as numbers for the greenhouse effect. I know you tried to answer this before, but where is the 183 difference originating from? My guess is that one number is showing the system as it is now (342), and the other is showing things as they would be if there was no atmosphere on Earth at all (159), but those numbers really should be in separate graphics, not the same one, as they are showing different systems. Maybe I misunderstand.
The skinny little bit of red arrow feeding into "atmospheric heat flow" is unlabeled, so I'm not sure what it represents.
Why does "atmospheric heat flow" jog to the right when adding in absorbed sunlight? Where does the heat on the left side go?
What is "Atmospheric heat flow" as a form of energy? It's like we're being precise about energy forms except there.
Stylistic issues:
The fonts are still too small for smartphone and thumbnail. This is OK for graphics in the article, but is really not OK for the lead of an article.
It think it's a bit confusing to have "thermal radiation from surface" change color when splitting between "outgoing thermal radiation" and "342 up"- it's not like it changes type. I would reserve different colors for when energy changes type.
I'd delete the text "(no heat transferred)"- that's pretty obvious I think. Going further, you could merge "Greenhouse gases & clouds" with "Cancelling exchange of radiation (no heat transferred)" to say "Greenhouse gases and clouds redirect heat".
For redirecting heat upwards you have a twisty "heat flow" curve, but for redirecting heat back down you just have an up arrow and a down arrow. The visual language should be the same between the two I think.
"It is still unclear to me why you have 342 and 159 as numbers for the greenhouse effect." The greenhouse effect is quantitatively defined as the "surface thermal radiation" minus "outgoing thermal radiation," i.e., G = 398-239 = 159 W/m2, as reported by the IPCC (p. 968 AR6WG1). (The normalized GHE is g̃ = 0.40 is G/398.) The 398 and 239 are values which both exist in the current system, and need not be interpreted by referring to some other hypothetical system. The value 342 doesn't come into play. There are vertical lines in the diagram aligning to both sides of the 398 surface flow; it's that value that the 159 is being measured with respect to. When scientists talk about "radiative forcing" due to increasing GHGs, this involves an instantaneous change in the value of G.
"The skinny little bit of red arrow feeding into "atmospheric heat flow" is unlabeled, so I'm not sure what it represents." The two skinny red lines together are labeled "radiation heat transfer." The one on the left represents radiation heat transfer to the atmosphere, and the one on the right represents radiation heat transfer straight to space.
"Why does "atmospheric heat flow" jog to the right when adding in absorbed sunlight? Where does the heat on the left side go?" Left-right positions on the diagram have no physical meaning. "Outgoing thermal radiation" flow was positioned directly above "thermal radiations from surface," to make it easy to compare these two flows, and measure the greenhouse effect as the difference between these two energy flow rates. Some flows were drawn with a "jog to the right" to allow the outgoing and surface thermal emissions to be vertically aligned visually. The heat on the left side doesn't "go" anywhere; the drawing of the flow just shift to the right while maintaining its width, to convey consistency in the overall heat flow rate.
"What is "Atmospheric heat flow" as a form of energy? It's like we're being precise about energy forms except there." Earth's Energy Budget diagrams only convey information about the energy flows at the interfaces between the realms of Space, Surface, and Atmosphere. They never offer information about what happens inside the atmosphere. My diagram is precise about energy flows that cross between two realms. The "atmospheric heat flow" is a catch-all for all net energy flows going on inside the atmosphere. My data sources provide no breakdown of that into different types of energy flows, so I can't break it down in the diagram. In other versions of the diagram, the "atmospheric heat flow" is there implicitly but not explicitly. I wanted to make it explicit so that one could visually trace energy being conserved.
"I'd delete the text "(no heat transferred)"- that's pretty obvious I think." If only it was obvious to everybody, but it isn't. Just yesterday I had a climate skeptic look at this exact diagram and tell me "heat is being transferred to the surface," despite the notation saying otherwise. It's a widespread belief among climate skeptics that these diagrams depict heat being transferred to the surface. For that audience, it's essentially that the diagram explicitly says "no heat transferred." That's one of the two main points I was trying to make by the way I constructed this version of the diagram.
"Going further, you could merge "Greenhouse gases & clouds" with "Cancelling exchange of radiation (no heat transferred)" to say "Greenhouse gases and clouds redirect heat"" That would eliminate all the clarity about cancelling radiation flows not constituting a heat flow, which is a major purpose of my producing this version of the energy budget diagram.
"It think it's a bit confusing to have "thermal radiation from surface" change color when splitting between "outgoing thermal radiation" and "342 up"- it's not like it changes type. I would reserve different colors for when energy changes type." Because of the issue I mentioned in the preceding bullet points, I felt it was important to distinguish between radiative heat flows and radiation flowswhich do not constitute heat flows. That's why the 342 up & down are in a different color. The only thing that I think was a bit awkward was what to do with coloring the 398 surface emissions, since some of that turns into a heat flow and some of it doesn't. I ended up choosing a color which is in some sense intermediate between the two other colors. Not a perfect solution, but it's the best I've come up with so far. Maybe an alternative would be to have "thermal radiation from surface" be a transparent box with a border which is overlaid over the separate "radiation heat transfer" and non-heat radiation-up flows?
"For redirecting heat upwards you have a twisty "heat flow" curve, but for redirecting heat back down you just have an up arrow and a down arrow. The visual language should be the same between the two I think." Hmmm. First, a correction: radiation energy is redirected back down, but thermodynamic "heat" is not. And, that distinction between heat flows (some of which are also radiation flows) and radiation flows (which are not heat flows) could be an excuse for using a different visual language. Yet, there is merit in asking for a similar visual language (which is a language designed to visually show energy conservation). Doing that would require that the top and bottom of the region containing the 342 up and down flows be capped with a semicircle, instead of being circled with flattened green-dashed ellipse as is the case currently. To make everything fit would require significant vertical stretching of the diagram as a whole--which won't help the situation with regard to the font-to-diagram size ratio. But, it might give the design more integrity, so maybe I'll give it a try some time, so see what I think of it.
"The fonts are still too small for smartphone and thumbnail. This is OK for graphics in the article, but is really not OK for the lead of an article." That guideline strikes me as being "good to honor if it's practical to do so" but not a rigid rule. (Are you aware of any Wikipedia policy on this?) It's certainly not always honored; Earth's energy budget, for example, uses the NASA diagram in the lead-in, which has even smaller fonts relative to the diagram size. I think that this particular diagram of mine is trying to convey a level of detail which simply can't be well-conveyed with larger fonts. If and when we find a diagram that we agree would be better to use in the lead-in, I'll happily shift the diagram to the main article. I just don't think we're at that stage yet.
—Prof. Hossenfelder's video was enlightening, though underlying the entire analysis is the statement at 4:55+ and repeated later, is that "The temperature of Earth increases until the total energy that's emitted is the same as what comes in from the sun." Initially seems to me that this premise implies a planet's total energy content must remain constant, which isn't generally true. Maybe she meant the total energy that's emitted by the ground and ocean into the atmosphere, and not what's emitted into space by the planet as a whole?
—Regardless, I appreciate that the deeply-understood GHE is too complex to exhaustively represent in a simple diagram. The task is: which diagram is appropriate for a lead, and which are more appropriate for Earth's energy budget or other more techy articles. Of course, minimizing graphical elements is a good goal also. —RCraig09 (talk) 20:41, 4 May 2023 (UTC)Reply[reply]
Sunlight and Earth's thermal radiation occupy different regions of the electromagnetic spectrum which largely do not overlap.
What Hossenfelder says is correct. It follows from energy conservation that dU/dt = Sa - OLR where Sa is the rate of sunlight being absorbed, OLR is the rate of thermal radiation being emitted to space, and dU/dt is the rate of change of the Earth's total energy. Whenever more energy is coming in than is going out (i.e., Sa > OLR), dU/dt > 0 and Earth's total energy increases -- which corresponds to temperature increasing. As temperature increases, OLR increases. When it finally gets to a point where OLR = Sa, then dU/dt = 0 and the total energy content and the energy both stop increasing. Is there anything about that which doesn't yet make sense?
Ideally, a graphic in the lead-in would depict something that is key to how the greenhouse effect functions. To me, the key ideas involved in how the greenhouse effect functions include (a) the greenhouse effect involving a reduction in cooling, as indicated by the rate of thermal radiation reaching space being less than the rate that leaves the surface, and (b) temperature of a planet being driven by the balance between heating and cooling -- or something that conveys the connection between reduced cooling and temperature, a bit more technically than what is conveyed by the initial image.
Lacking a good image that addresses that, I suppose one option would be something like the image whose thumbnail I've included here. It has the virtue of addressing something readily understandable. But, that's arguably also a disadvantage: it presents what everyone already knows about the greenhouse effect, rather than something that isn't already widely know. Rhwentworth (talk) 23:59, 4 May 2023 (UTC)Reply[reply]
Thank you for explaining. Aah, what you're describing must involve a substantial time delay, whereas I was picturing something closer to instantaneous, to maintain a steady state. I now appreciate the closing paragraph of this description: "Under stable conditions...". (PS There's a 240-vs-239 discrepancy in your File:Earth Energy Budget with GHE.svg—intentional?) —RCraig09 (talk) 03:03, 5 May 2023 (UTC)Reply[reply]
Yes, it takes time, ranging from weeks (for a small fraction of the changes) to many centuries (for the full change which involves raising the temperature of the oceans). Right now we're racking up a lot of "deferred warming" -- temperature changes that are locked in, but which will take a long time to fully show up. The 240-vs-239 discrepancy between between sunlight absorbed and outgoing thermal radiation is because there is currently a net radiative imbalance. That's why there is a "net absorbed" value of 1, which indicates the rate of increase in the total energy. Rhwentworth (talk) 05:01, 5 May 2023 (UTC)Reply[reply]
Let me focus down on the two major issues of substance with this diagram:
You still did not address the question of 342 vs 159. The diagram says 342 is deflected by greenhouse gases and clouds. Then the diagram says 159 is deflected by the greenhouse effect. You have two wildly different numbers that are both effectively saying they represent the greenhouse effect. In your explanation above you dismiss the number 342 saying "The value 342 doesn't come into play." If so, why have it in there? What does it represent? Are you trying to say 159 is the greenhouse effect and 342-159 = 183 is the effect of clouds? If so, the the right alignment to the 342 bar is wrong, because up top you are saying that's due to the greenhouse effect. The whole thing is just incoherent.
Jogging the atmospheric flow to the right is a huge problem because you are using vertical lines on the right hand side to explain the greenhouse effect. The size of the gap on the right hand side is entirely due to the fact that you jogged the flow over to the right. What about the magic gap you've created on the left hand side by jogging heat flow to the right? It's like that farside cartoon of an equation where in the middle it says "and then a miracle occurred".
What I think you may not be realizing is that even if this diagram is correct in your mind, it is going to fail to make sense for almost 100% of the people visiting wikipedia. Efbrazil (talk) 17:40, 5 May 2023 (UTC)Reply[reply]
Partial solution: I think it's better to not imply the GHE is located at any one altitude or location. (An overall label could say "The Greenhouse Effect".) I agree that the present diagram (esp. terms like "atmospheric window") requires a lot of "decoding" of unexplained terms, to figure out what it says. I'm not sure if it's stylistic or substantive, but: it seems the four upwardly projecting "heat flow" elements would best be in a straight line (rather than jogging right), so that the effects of GHGs would be more separate from the left side's elements. —RCraig09 (talk) 18:00, 5 May 2023 (UTC)Reply[reply]
Yeah, there's lots of layers here- substance, correctness, wording, stylistic. I want to get through substance first. I still think the best use of time would be enhancing an existing diagram, like this one: File:Earth heat balance Sankey diagram.svg. Maybe I'll tackle that one actually, it has good bones but there's lots of room for improving the labels. Efbrazil (talk) 18:19, 5 May 2023 (UTC)Reply[reply]
— Maybe we're trying to do too much, accounting for each and every energy pathway even if it's not directly pertinent to the GHE. Conversely, File:Earth heat balance Sankey diagram.svg doesn't presently mention GHGs at all.
— Critical: Are we still focusing on a diagram solely for the GHE lead? Or energy paths in general? We've got to be clear on our goal. —RCraig09 (talk) 18:37, 5 May 2023 (UTC)Reply[reply]
Our senses of what has value clearly differ. I perceive File:Earth heat balance Sankey diagram.svg as one of the least informative, least intuitive, least useful or appealing presentations of Earth's energy flow that I've encountered. It has the virtue of making energy conservation apparent, which is good. But, I don't see any other virtues in it. And, as RCraig09 points out, it doesn't mention GHGs or offer any clarity about the GHE. It's not remotely plausible to me that it would be appropriate for use in the GHE article lead-in. Rhwentworth (talk) 20:33, 5 May 2023 (UTC)Reply[reply]
Yep, if I modify Earth heat balance Sankey diagram it will simply be to improve the quality of the labels, that is all. I'm not intending it for this article really. Efbrazil (talk) 20:50, 5 May 2023 (UTC)Reply[reply]
The diagram is not implying the GHE "is located at any one altitude or location". It is implying that it is the difference between two specific values, the value of the thermal flux at the surface and the thermal flux at top-of-atmosphere. This is factually how the GHE is quantitatively defined. There is simply, visually, one place where that non-local value can be measured in a diagram.
There a several reasons why this particular energy-flow diagram looks different than other versions of the diagram:
To enable showing visually the quantitative definition of the GHE.
To highlight that the GHE is a whole-atmosphere phenomenon, not simply a surface phenomenon, as diagrams like File:Greenhouse Effect.svg misleadingly imply.
To depict both heat flows and radiation flows that do not constitute heat flows in ways that visually distinguish these; most diagrams blur these together in a way that produces endless confusion among some interpreters. (Other diagrams leave out the non-heat radiation flows, but that doesn't solve the problem either, since the audience in question doesn't understand why they are being left out, and simply ignores such diagrams.)
To visually show energy being conserved.
These advantages to this particular version of the diagram are essential to combatting common ways in which climate skeptics are confused by and consistently misinterpret more standard renditions of the energy-budget diagram.
The suggestions to not show the GHE as being anything in particular or to make the heat flows go straight up all violate goals #1 and #2.
The "effects of GHGs" are NOT just present to the right, in the downwelling radiation; they are also very much present in the comparison between OLR and surface radiation.
I get that this diagram doesn't meet the criteria that the two of you have for what you'd like to see in the lead-in. Fine. I'll move it to the body of the article.
But, this particular diagram exists to address the points above, and it would be counterproductive to adopt any suggestion that would abandon addressing those points would be counter to the purpose of the diagram. Rhwentworth (talk) 20:26, 5 May 2023 (UTC)Reply[reply]
Gotta run, so will come back to the point about 342 vs 159. Rhwentworth (talk) 20:42, 5 May 2023 (UTC)Reply[reply]
Thanks! I know this process is painful, you're being a good sport with all the critiques. The issues of substance should really be resolved before the graphic goes anywhere on wikipedia though. As the graphic currently appears, it simply doesn't make sense. The more stylistic and editorial issues we're debating will play into how prominent the graphic should be. Efbrazil (talk) 20:55, 5 May 2023 (UTC)Reply[reply]
Yes, it sometimes seems like hard going. I appreciate the acknowledgement of that. It helps that we're all being civil. Addressing the critiques has led to major improvements, which I appreciate. Rhwentworth (talk) 04:02, 6 May 2023 (UTC)Reply[reply]
Earth Energy Budget with GHE
Ok, let's talk about "the question of 342 vs 159." Please reference the newest version of the diagram.
"The diagram says 342 is deflected by greenhouse gases and clouds. Then the diagram says 159 is deflected by the greenhouse effect." I don't know what you mean by the term "deflected." However, I can't imagine any meaning of the word that would be appropriate to apply to the 159. In the case of the 342, it's more accurate to simply say that, in interacting with the surface, GHGs+clouds absorb and emit that amount (342 W/m²).
"You have two wildly different numbers that are both effectively saying they represent the greenhouse effect." GHGs+clouds impact multiple quantities that one could measure. (They also affect the 239 emitted to space.) There's no contradiction in acknowledging the reality that multiple values are affected. The diagram doesn't say the 342 "represents the greenhouse effect." That's purely an interpretation that you are putting on it, for some reason. (I've modified the diagram to clarify the multiple places that greenhouse gasses and clouds play a direct role; maybe that will help?) The 342 does offer a secondary metric that people sometimes look at. However, the primary metric scientists use to measure the greenhouse effect is the one with the value 159. That's the value that the IPCC refers to as the "greenhouse effect" when they discuss a specific value. That's the value that studies look at when they compare how large an effect different gases have on the greenhouse effect. That's what is changing when increasing greenhouse gas concentrations produce a "radiative forcing"; it's not the value 342 that is changing by that amount--that metric changes by some other amount that is not related in any simple way to the radiative forcing value.
"In your explanation above you dismiss the number 342 saying "The value 342 doesn't come into play." If so, why have it in there? What does it represent?" The number 342 "doesn't come into play" in the sense that (a) if's not the metric that is primarily being referred to when the "greenhouse effect" is measured, and (b) it's not used in calculating the primary metric, which has the value 159. As to "why have it in there", it is one of the significant energy flows in the system, albeit not a heat flow. And, it is a flow that is present in the most commonly viewed version of the Earth's Energy Budget diagrams, so people expect to see it. This version of the diagram simply provides a clearer context for understanding the significance of this energy flow. As for "what it represents", one could say that 342 the amount by which greenhouse gases and clouds reduce surface radiative heat loss. This contrasts with the value 159, which is the amount by which greenhouse gases and clouds reduce planetary radiative heat loss. The values differ, in part because any reduction in surface radiative cooling can potentially be partially compensated for by evaporation and convection. (Also, sunlight absorbed in the atmosphere plays a role.) The planetary value (159 W/m²) is by far the more significant one, when it comes to assessing the impact on planetary temperature, and even when it comes to assessing the impact on surface temperature.
"Are you trying to say 159 is the greenhouse effect and 342-159 = 183 is the effect of clouds?" No. Why would you subtract 159 from 342? That difference doesn't correspond to anything in the diagram and has no physical meaning.
"If so, the the right alignment to the 342 bar is wrong, because up top you are saying that's due to the greenhouse effect." The right alignment is to the right edge of "thermal radiation from surface"; I'm open to ideas about how to make that clearer. (Perhaps the new text saying "40% of 398" might help bring attention to than intention?) That the righthand alignment edge lines up with with the right edge of the 342 bar is an unavoidable coincidence.
Guessing you might ask about the notation "40% of 398" that I've added to the text about the "greenhouse effect"... The IPCC also recognizes a metric, the "normalized greenhouse effect", g̃ = 0.40 = 159/398. One quite simple way of summarizing the greenhouse effect quantitatively is to say that "40% of the thermal radiation emitted by the surface doesn't reach space." When the greenhouse effect increases, this percentage increases. (Over the last 20 years, the value increased from 39.7% to 40.1%, based on NASA CERES data.)
"The whole thing is just incoherent." I get that you're had difficulty making sense out of certain aspects of the diagram. Likely that's been frustrating. The diagram itself is coherent. I hope that it might slowly begin to make more sense to you.
"Jogging the atmospheric flow to the right is a huge problem because you are using vertical lines on the right hand side to explain the greenhouse effect. The size of the gap on the right hand side is entirely due to the fact that you jogged the flow over to the right." The greenhouse effect is defined as the difference between the size of the "thermal radiation from surface" and the size of the "outgoing thermal radiation." The "jogging the atmospheric flow to the right" is done for the purpose of aligning the left-hand edges of these two flows, as is indicated by the white dotted line connecting the left-hand edges of these two flows. That alignment of the left-hand edges of the two flows means that when one compares the right-hand edges of the two flows, the difference in their positions yields the difference in the sizes of these two flow, i.e., it yields the greenhouse effect as it's quantitatively defined. If I hadn't aligned the left-hand edges, then any gap on the right-hand side would be meaningless. It is because I've aligned the left-hand edges in the exact way that I have that the gap on the right becomes meaningful.
'What about the magic gap you've created on the left hand side by jogging heat flow to the right? It's like that farside cartoon of an equation where in the middle it says "and then a miracle occurred".' There's no "magic gap." Other horizontal positions don't have any physical significance, and no significance has been attributed to them in the diagram. The concept of what I'm doing is really simple: if you want to visually compare the widths of two boxes, you align them on one side, and then measure the difference in the positions on the other side. Surely that makes sense?
"What I think you may not be realizing is that even if this diagram is correct in your mind, it is going to fail to make sense for almost 100% of the people visiting wikipedia." I concede that it won't make sense to most people, without study. However, I wonder if you realize that 99.9% of people who visit Wikipedia won't actually understand the greenhouse effect at all well, even after reading the article. I'm trying to offer a learning resource that will reward careful study, and which will serve as tool for clarifying widely-held misconceptions about the greenhouse effect. (Those misconceptions are important because, in general, it's great if scientific concepts are accurately understood, and practically, insofar as those misconceptions are the basis for a great deal of denial of the reality of the greenhouse effect.) Please realize that the audience of our readers is diverse, with widely varying levels of knowledge and ability to understand content. I don't want to serve only the least-knowledgeable readers. I'd also like the article to be a resource for people at various stages in their learning process.
For what it's worth, I shared the diagram in another context, and some participants there really liked the distinctive features of this version of the diagram, and found them helpful.
Thanks for the detailed answers! The diagram makes sense to me now, so I think we're past substance and into style now. I think you meant to say 342, not 234 here: "one could say that 234 the amount by which greenhouse gases and clouds reduce surface radiative heat loss. This contrasts with the value 159, which is the amount by which greenhouse gases and clouds reduce planetary radiative heat loss."
In terms of deconfusing the diagram, I would remove the 159 "greenhouse effect" number and instead explain it in the caption. That would solve several problems:
It would remove the problem of having 2 numbers on the diagram both labeled as though they are the greenhouse effect- one says "effects of greenhouse gases and clouds" while the other says "surface emissions greenhouse effect". To most people, that's the same thing.
It would focus the diagram on energy flows, which is the important thing here. Why garbage up the diagram with a number that happens to be used to describe the extent of the greenhouse effect?
It would remove the need for the right hand jog of the arrow, which only exists so you have have those dotted lines line up.
Finally, the freed up space could allow for the fonts to be bumped up for readability on smartphone and thumbnail.
The caption could say something like this instead: "The difference in thermal radiation from Earth's surface (398 W/m^2) and Earth to space (239) is 159 W/m^2 (40%), which is the number used to describe the extent of the greenhouse effect." Efbrazil (talk) 17:40, 6 May 2023 (UTC)Reply[reply]
Yes, there were a number of numerical typos in my explanation above; I've gone back and fixed them, for the benefit of any future readers.
I'm not at all enthused about the idea of removing the greenhouse effect value, 159, from the diagram. The general intention of the diagram is to offer people a version of the energy-budget diagram which contrasts with their misconceptions and invites new clarity about those issues. One of the key misconceptions the diagram exists to address is the idea that the greenhouse effect "is" that 342 value.
"It would remove the problem of having 2 numbers on the diagram both labeled as though they are the greenhouse effect..." There aren't just 2 numbers labeled in that way. The caption "effects of greenhouse gases & clouds" links to 4 locations in the diagram where GHGs emit or absorb radiation. Only someone who is jumping to conclusions (or who has a preconceived notion that needs to be corrected) assumes that a particular number from among those 4 "is" the GHE. Having the actual GHE appear explicitly in the diagram confronts any such mistaken assumption. That's a desirable feature, not a bug.
"To most people, that's the same thing." Again, GHGs and clouds have multiple effects, but only one is quantitatively called the greenhouse effect in mainstream scientific usage. I wonder if it would in any way help to change the label from "effects of greenhouse gases and clouds" to simply "greenhouse gasses and clouds"? Maybe that would reduce any tendency towards being puzzled by the seeming similarity?
"It would focus the diagram on energy flows, which is the important thing here." What is important in a diagram depends on its purpose. To me, the purpose of this diagram is to provide a context for understanding how the greenhouse effect value arises; omitting that value would run contrary to that purpose.
"It would remove the need for the right hand jog" One of the issues the diagram exists to clarify is "How do evaporation and convection play into determining the value of the greenhouse effect?" Having a diagram in which the greenhouse effect appears visually is essential to supporting that understanding. It shows that evaporation and convection are a non-radiative effect at the surface, but their energy crosses over to the radiative-effects side of the diagram by the time one gets to top-of-atmosphere, influencing the greenhouse effect. That jog represents an energetic type shift from non-radiative effects to radiative effects. (Hmm... maybe I should modify the diagram to make that explicit?) This is another case where what you're complaining about is a feature, not a bug.
"instead explain it in the caption" This strategy is unsatisfying in a number of respects. One is that the diagram will likely be re-used in other articles, and each article determines the caption. So, if something is essential to the purpose of the diagram, it doesn't do to leave that to the caption. Secondly, the intention of showing how evaporation, convection, and absorption of sunlight in the atmosphere influence the greenhouse effect value entirely depend on the greenhouse effect value being displayed visually/geometrically in the diagram. You can't achieve that with a caption.
I just added some annotations to File:Earth_Energy_Budget_with_GHE.svg below the main diagram to clarify how the diagram is organized, e.g., with a dividing line between sunglight/non-radiative & thermal radiation. Rhwentworth (talk) 21:29, 6 May 2023 (UTC)Reply[reply]
Back to the topic of finding another basic diagram, for possible use in the lead-in, I've made a crude first draft of a diagram that can be referenced to reliable sources. See GHEfromLapse.jpg The aesthetics need to be improved, and we'd need to figure out what caption goes with it... but it convey an established simple-ish way of understanding the GHE. Thoughts? A bit later: Here's a Second Draft of the new diagram. Rhwentworth (talk) 09:57, 7 May 2023 (UTC)Reply[reply]
Thanks! I think it is an improvement to remove "effects of" from greenhouse gases and clouds.
I still think the graphic is too confusing for leads of articles though- both because it is trying to do too much, and because the fonts have to be too small to be legible.
Regarding the other new graphic, I again encourage you to find an existing graphic from a reputable source that you are adapting. At the very least, I'd need to see source data for the point you are trying to make. Note that synthesizing graphics from multiple sources is disallowed:
Note that the "synthesis" guideline doesn't simply say you can't combine graphics; it says you can't combine material "to reach or imply a conclusion not explicitly stated by any source." That offers a bit more leeway, insofar as a source often states various conclusions, not all of which are included in their version of the graphic. Rerencing such conclusions in a derived graphic would seem to be permitted.
Here are some references for the graphic suggested above (Second Draft):
The following journal article by Rasmus Benestad argues for simplifying the above, for pedagogic purposes, to thinking of the atmosphere as radiating from a single ’equivalent bulk emission level’. This is calculated from the overall “emission temperature” Te ≈ 254K characteristic of outgoing longwave radiation (which balances incoming absorbed sunlight of 240 W/m^2). The ’equivalent bulk emission level’ is the altitude at which the atmospheric temperature corresponds to Te. This level was found to be about 7.2 km, and to be increasing as greenhouse gas concentrations have increased. https://link.springer.com/article/10.1007/s00704-016-1732-y
A slide show from University of Wisconsin shows a similar figure https://www.aos.wisc.edu/~aos121br/radn/radn/sld015.htm (see also slide 18 and 19 for what happens when CO2 concentration increases) Slide 12 defines the “effective radiating level”
This video (at timestamp 30:44) shows a similar figure, complete with temperature labels and a labeled lapse rate. (A few minutes later it shows what happens when CO2 increases.) https://www.youtube.com/watch?v=8Ukxv5-pwlg&t=1844s
Physicist Sabine Hoffstader’s video (7:10 to 8:55) talks about IR being absorbed at low altitudes, then being able to escape to space at an altitude where the air gets thin enough: https://www.youtube.com/watch?v=oqu5DjzOBF8&t=430s
There is another illustration that I'd like to bring into the greenhouse effect article: a chart with a curve of outgoing longwave emissions to space versus frequency and a curve of longwave surface emissions, with the area in between colored in as the greenhouse effect.
Such an illustration is a very concrete illustration of both the concrete, measured existence of the greenhouse effect, and of the specific role of CO2 in that effect (since a large portion of the effect is in the range of frequencies where CO2 absorbs).
This is a widespread idea. An example of such a figure is HERE. While this particular image is likely copyrighted, I believe I can produce a similar illustration based on public information. Here's another version of such a figure. Rhwentworth (talk) 19:57, 7 May 2023 (UTC)Reply[reply]
Ok, I just produced the new image described in my prior comment SpectralGHE1.png. This illustration shows how the greenhouse effect shows up in the spectrum of radiation emitted to space. Rhwentworth (talk) 00:10, 8 May 2023 (UTC)Reply[reply]
— Rotating certain text 90° counterclockwise would make it easier to visually associate with flow paths: "82 evaporation" "21 convection" "56 radiation heat transfer" maybe others in that area of the diagram
— The rounded rectangles around certain text (but not others) makes the certain text look like additional separate drawing elements.
— The "298 thermal radiation from surface" box is a very dominant box that looks like a solid diagram element rather than just a label, and it seems partially redundant with the outgoing/GHE/Surface emissions text at the bottom. Maybe the dominant red 398etc box could be replaced with a curly bracket "{" rotated 90° counter-clockwise—with its text below the curly bracket.
It takes a lot of study to appreciate what's displayed, and any minimization of elements would be helpful to new people. —RCraig09 (talk) 18:25, 8 May 2023 (UTC)Reply[reply]
I’ll look into those suggestions. Might take some time for these minor tweaks as I’m going into a busy period. Vertical text would need to fit into a very tight space, so not sure if that will work. Tool I’m using doesn’t offer brackets, which makes that suggestion more difficult. I’ll think about whether there is anything I can do about the surface emissions box. Rhwentworth (talk) 22:39, 8 May 2023 (UTC)Reply[reply]
Made the requested changes. (Changes not showing up yet everywhere, but I trust that they will.) Rhwentworth (talk) 06:41, 9 May 2023 (UTC)Reply[reply]
Thanks for all your inspiration and perspiration... I think these changes clarify the flows a lot, though a few rounded rectangles remain that aren't necessary. Some labels would benefit from a change to a contrast-to-background font color, if removing the rounded rectangles causes a readability problem. —RCraig09 (talk) 14:44, 9 May 2023 (UTC)Reply[reply]
I tried to take the best of the existing energy flows diagram and Rhwentworth's take on the issue. Here's the result:
File:Greenhouse_Effect.svg is used a boatload of places, so some care is needed. I haven't verified numbers, so my comments are more for presentation. Substantively, I'm now puzzled by the *light* brown arc within the huge arrow leading to the 452 in the lower right of the OLD version: it's missing from your proposed version altogether, but I'm not sure if this is intended and correct. Graphically and conceptually, I liked the unified circular arrow that visually reinforces how the GHE causes energy to be retained, but it's substantively not necessary. For wrapping up a loose end, I suggest specifically reciting "Net absorbed (global warming) = 240 - 239 = 1 W/m^2". —RCraig09 (talk) 18:23, 9 May 2023 (UTC)Reply[reply]
Yeah, the old graphic is confusing and based on 30 year old data. My interpretation of it is that the giant arrow in light brown color is an aggregation of radiation, evaporation and convection. The dark brown colored part of that is meant to represent radiation being absorbed by the greenhouse effect. In the updated version I was clear about the energy types, both in terms of color and labeling.
The net absorbed could represented as 240-239 (energy flow from / to space) or 160+342-103-398 = 502-501 (energy flow to / from ground). Since the math works either way I didn't want to declare one way as the "right" way to view the data. But I think putting that info into the caption is a good idea. Efbrazil (talk) 19:10, 9 May 2023 (UTC)Reply[reply]
Greenhouse gases (GHGs) in dense air near the surface intercept most of the thermal radiation emitted by the warm surface. GHGs in sparse air at higher elevations emit thermal radiation to space, at a lower rate than surface emissions, due to the lower temperature. The temperatures at different elevations are connected via the environmental lapse rate. The surface is about 33℃ (59℉) warmer than the temperature needed to emit enough radiation to balance absorbed sunlight.
I'll address proposed revisions to File:Greenhouse_Effect.svg is a different comment. (Note: I'm rather busy this week.)
Here, I'd like to advocate for including the figure offered here, File:Greenhouse_Effect_Overview.svg, in the lead-in of the greenhouse effect article.
Advantages of the diagram:
It specifically addresses the issue of the temperature increase associated with the GHE.
It points toward central aspects of the physics involve:
radiative balance between the rates of radiant energy arriving and leaving
what greenhouse gases fundamentally do is shift the location of thermal emissions to space away from the warm surface to colder places higher in the atmosphere
the lapse rate offers a relatively intuitive way of understanding why, if the emissions that balance incoming sunlight are at a higher elevation, then the lower air and surface will be warmer
the diagram also ties into the (more rigorous) way of understanding the temperature rise as being due to a lowering of emissions to space, relative to surface emissions
I'd like to include the diagram in the article whether or not it makes the lead-in. However, I think it's better suited to the lead-in than the diagram that Efbrazil is talking about revising (which I'd love to see disappear entirely, unless, against the odds, it can be changed in a way that salvages it).
The older diagram File:Greenhouse_Effect.svg and the proposed revision both suffer from these disadvantages:
They show energy flows, but in a way that isn't particularly connected to meaning
The revised version doesn't mention the greenhouse effect at all, only calling attention to "net absorbed" -- which relates to the enhanced greenhouse effect, but not to the baseline natural greenhouse effect
The original version labels surface effects as being the greenhouse effect, when the primary greenhouse effect is the one that relates to emissions to space
Both versions offer the downward "back-radiation" energy flow as the only thing people can interpret as being the greenhouse effect. This is deeply problematic because:
It's not the primary effect which has a relationship to planetary warming
The downward radiation flow is widely and consistently misunderstood, as to what it means and what it says about how the GHE functions -- focusing on it basically perpetuates and reinforces the most serious misunderstandings that get in the way of people truly understanding or accepting the GHE
This focus reliably activates intense resistance among greenhouse-effect deniers; there are online forums with enormous readership whose express purpose is to ridicule the idea of "back-radaition" and the GHE, based on the misunderstandings of the GHE that this type of diagram has created among them.
I'm not ready for those revisions to appear (though they're not worse than the existing version).
Initial thoughts, then I really need to go...
The upward arrow labeled 40 in the old diagram and 56 in yours is likely to be interpreted as the radiation passing through the "atmospheric window." 40 is a plausible value for that, 56 is not, but there is no new value for the amount going through the atmospheric window, so any value offered wouldn't be fully reliable.
Similarly, the amount of upward thermal radiation absorbed in the atmosphere is 342 + 56 - [amount through atmospheric window]. So, again, the current data doesn't provide a reliable value to fit that label.
Maybe you could relabel things in a way that fits the known numbers, but there is a risk of that being done in a confusing way. ADDED: Or, you could base your numbers on the numbers in this diagram, which is older than my data, but newer than the data in the old diagram.
The asserted surface temperature of 14℃ is inconsistent with the upward radiation number 398 W/m^2. Probably the latter number requires the surface to be at 16℃, but there is a little room for discussion around that. Still, 14℃ is clearly incompatible.
The diagram offers a simplified version of Earth's energy budget, but doesn't particularly explain the greenhouse effect in any obvious way (unless one assumes the downward radiation flux is it, stimulating various likely misinterpretations).
Thanks Rhwentworth! Very good idea to use that 2009 diagram as basis.
I had misintepreted your diagram to say that 56 goes directly to space from the surface, but I see you were aggregating radiation that goes directly to space with radiation that is absorbed by the atmosphere and then goes to space.
What's confusing about that is that you have surface radiation being absorbed by the atmosphere in 2 different ways- there's the 342 that gets offset, and also the 56-40 = 16 that is absorbed the atmosphere and then gets radiated to space.
The 2009 diagram doesn't do that partitioning. It shows 358.2 of surface radiation being absorbed by the atmosphere, and back radiation of only 340.3, leaving a gap of 17.9. That seems to be a more accurate way to represent things, as your approach requires a magic partitioning that doesn't exist in reality.
I think you are contorting things a bit too much to make your case that the extent of the greenhouse effect is a matter of the ratio of thermal radiation to space vs thermal radiation from the planet's surface. I grant you that's true, but on a more basic intuitive level it's valuable to think of back radiation as a measure of how much insulation greenhouse gases are providing- how much they are slowing heat from escaping the planet. The greater the amount of back radiation, the greater the insulation effect.
I don't see the value in your new atmospheric layer diagram. Again, thinking in terms of insulation, of course with more insulation the inner layers get warmer and the outer layers get colder. That's really all the new diagram says, but it says it in a way that's needlessly confusing. Do you have a link to a diagram like that put out by NASA or the IPCC?
A separate issue is that the 2009 diagram has annoying off by 0.1 issues, probably just rounding issues in the source data but it makes it so the numbers in the diagram don't add up nicely. They partition 340.4 incoming radiation into 99.9 reflection, 77.1 atmosphere, and 163.3 surface. Unfortunately, 99.9+77.1+163.3 = 340.3, not 340.4. Similarly, they have thermal radiation from surface as 398.2 that they partition into 40.1 to space and 358.2 to atmosphere, but of course 358.2+40.1 = 398.3, not 398.2. I guess that's what captions are for.
Anyhow, I updated my take on traditional diagram here, but you probably still won't like it as it's really just updated numbers, not updated concept. Efbrazil (talk) 20:12, 10 May 2023 (UTC)Reply[reply]
The design of the diagram has multiple purposes. You're missing the purpose of the particular design choice you're noticing.
"The greater the amount of back radiation, the greater the insulation effect." That's true. However, few people understand that without an explanation--and some obstinately fail to understand that even with an explanation.
There is a persistent myth that energy balance diagrams show "heat" flowing from the cold atmosphere to the warm surface, violating the Second Law of Thermodynamics. This trope is a primary rallying cry of those who deny the reality of the greenhouse effect.
It is for purposes of combatting that misunderstanding that my version of the diagram distinguishes radiation heat flows (as they are thermodynamically defined) from non-heat radiation energy flows (which need not flow from hot to cold). There are NASA versions of the diagram which also make this distinction. (See the two diagrams on this page.) However, they do so using separate diagrams, and most people don't seem to understand how the separate diagrams relate to one another. So, the intention in this diagram was to show radiation heat flows and non-heat radiation flows together in the same diagram, to support clarification of this issue.
Yes, there are two radiation flows in the diagram that get absorbed in the atmosphere. But, one depicts a thermodynamic heat flow, while the other does not. This distinction is important because it is essential to combatting the myth of heat flowing from cold to hot in such diagrams.
Re your updated diagram... The updated numbers seem good, as far as they go. It's not clear what the point of the diagram is, insofar as the presentation is so similar to the diagram from which you are taking the data. The point of my diagram is that it clarifies several issues that are routinely problematic in the way that other presentations of the diagram get misinterpreted. Yes, some might find the presentation slightly less familiar and intuitive, but when the intuitions that the nominally simpler diagram stimulates are wrong, that's not a bad thing. Rhwentworth (talk) 15:11, 11 May 2023 (UTC)Reply[reply]
Your updated diagram still contains the inconsistent 14℃ figure. A naive calculation indicates 398 W/m2 corresponds to 16.3℃. A more sophisticated calculation can get the number down to 15.3℃. (A more realistic calculation that accounts for recent measurements of Earth's emissivity arguably raises the number to 18℃. But, most scientists have given up bothering to name an absolute temperature.) In any event, 14℃ is completely inconsistent with the other data in your diagram. I'd use a value of 15℃ or 16℃, or omit the temperature. Rhwentworth (talk) 15:40, 11 May 2023 (UTC)Reply[reply]
The 14 C number is the current planetary average as reported by the IPCC and NASA. Reporting a different number will raise more questions than it answers.
Is the discrepancy between 14 C and 15 or 16 C because the 14 C number is based on air temperatures just above the ground, while the 15 C / 16 C numbers are ground temperatures? Or is it because 14 C is an average, and temperatures are over a range, so the radiation emissions are centered on the 16 C number?
Anyhow, I don't think it is critical to report the number at all, and the diagram arguably already has too much text, so I removed the 14 C number for now.
Our primary audience for the lead is people unfamiliar with how the greenhouse effect works and want a passing familiarity. For that reason, the graphic at the top of the article should present the system in a way that is as clear as possible and is viewable on smartphone and thumbnail. Refuting specific misunderstandings and pseudoscience is better reserved for later in the article. Efbrazil (talk) 17:47, 11 May 2023 (UTC)Reply[reply]
The surface vs. near-surface temperature issue could explain the discrepancy. That's a good thought, regarding a likely explanation. (The issue of the number being an average over a range of actual surface temperatures is what lowers the surface temperature from 16.3 to an average 15.3℃, before one takes emissivity into account, which would send the number much higher.)
Most sources currently report temperature anomaly, rather than absolute temperature. One source that claims to be using NASA/NOAA data does offer an absolute temperature, and claims the mean global temperature has been over 15℃ every year since 2015. The number 14℃ is apparently a baseline for the period 1950-1980.
# #
You seem to be continuing to argue an issue that had already been agreed: I've agreed (multiple times) that it made sense to present File:Earth_Energy_Budget_with_GHE.svg later in the article, and not at the top of the article.
A more pertinent issue is what diagram WOULD make sense to include in the lead. You haven't responded yet to my proposal (above, from 2 days ago) for using the file File:Greenhouse Effect Overview.svg and associated caption in the lead-in. Rhwentworth (talk) 22:16, 11 May 2023 (UTC)Reply[reply]
Regarding File:Greenhouse Effect Overview.svg, it seems to be built around the idea that the lower and upper atmosphere behave in different ways, which I don't think is accurate or helpful. In terms of the level it is communicating at, I find the insulation analogy is most helpful. Insulation works the same way all the way through- it's just slowing the movement of heat energy and thereby increasing the heat gradient. There are obviously complications that break the analogy, such as that radiation to space is not just happening from the outer surface of the atmosphere and that atmospheric density changes with altitude. Still, the analogy holds up overall.
Maybe the description in the very first diagram could be updated to make the insulation analogy more explicit. We currently say:
Greenhouse gases absorb and redirect heat radiated by Earth, preventing it from escaping into space
How about if we say this instead?
Greenhouse gases absorb and redirect heat radiated by Earth, insulating it from heat loss to space
As for the energy flow diagram, I agree it isn't great at explaining the greenhouse effect, but it does help to explain energy states and how heat flows through the atmosphere. I think that's valuable to present up front and can be built upon to develop a basic understanding of the greenhouse effect. You think it can lead to misunderstandings, but just because it can be extrapolated in the wrong direction doesn't mean it has to be.
I haven't found any other images online that I think are a step forward. And as Craig said, I've spent a fair bit of time on this even before this effort started. Efbrazil (talk) 18:28, 12 May 2023 (UTC)Reply[reply]
User:Efbrazil: “Regarding File:Greenhouse Effect Overview.svg, it seems to be built around the idea that the lower and upper atmosphere behave in different ways, which I don't think is accurate or helpful.”
You don’t “think” it’s accurate? So, your intuition trumps facts, sources, and understanding?
The body of the article we are editing backs up and matches the narrative in my figure. The article says:
“In reality, the atmosphere near the Earth's surface is largely opaque to thermal radiation and most heat loss from the surface is by convection. However radiative energy losses become increasingly important higher in the atmosphere, largely because of the decreasing concentration of water vapor, an important greenhouse gas. Rather than the surface itself, it is more realistic to think of this outgoing radiation as being emitted by a layer in the mid-troposphere, which is effectively coupled to the surface by a lapse rate.”
So, why would you reject, for the lead-in, a figure that matches what is said in the main content of the article?
(I’ve also supplied references to back up the figure, and links to similar figures offered by reputable sources. And, if you care to understand, I could explain in more detail the science behind why the above narrative is accurate.)
# # #
Efb: “I find the insulation analogy is most helpful. Insulation works the same way all the way through- it's just slowing the movement of heat energy and thereby increasing the heat gradient…. Maybe the description in the very first diagram could be updated to’… Greenhouse gases absorb and redirect heat radiated by Earth, insulating it from heat loss to space’ ”
I find that updated description text acceptable, and possibly helpful.
“There are obviously complications that break the analogy. Still, the analogy holds up overall.”
The analogy is useful in broad terms, but doesn’t hold up at all well to close examination. While, as you say, a blanket “increases the [temperature] gradient,” that does NOT happen in the greenhouse effect. The temperature gradient in the atmosphere is the “lapse rate”, which is (mostly) not affected by changes in the greenhouse effect. Instead, increasing greenhouse gases increases the thickness of air over which lapse rate is relevant, without much changing the value of temperature change per distance. That behavior is in some significant ways quite different to what happens with blankets.
Efb: “As for the energy flow diagram, I agree it isn't great at explaining the greenhouse effect, but it does help to explain energy states and how heat flows through the atmosphere. I think that's valuable to present up front and can be built upon to develop a basic understanding of the greenhouse effect. “
But ARE you concretely planning on adding content to the article to “build upon” such a figure? If not, you’re offering a purely hypothetical justification. As it happens, I am planning on adding specific content that would build on the figure that I’m proposing for use in the lead-in.
# # #
Efb: “You think it can lead to misunderstandings, but just because it can be extrapolated in the wrong direction doesn't mean it has to be.”
That logic might make sense if there was a really compelling reason to show that figure despite it in my experience USUALLY leading to misunderstandings. But, you haven’t offered any such compelling reason.
# # #
Efb: “I haven't found any other images online that I think are a step forward. And as Craig said, I've spent a fair bit of time on this even before this effort started.”
I appreciate that you’ve been committed to this topic for a while. Nonetheless, you’re clearly not as well-read concerning this topic as I am.
To me, File:Greenhouse Effect Overview.svg is far more effective at pointing towards how the greenhouse effect operates than is File:Greenhouse Effect.svg. I get that it’s not a presentation that’s familiar to you, as yet. I’ve offered references that could familiarize you with this way of presenting things. It’s ok if you don’t want to pursue that for your personal learning. But, I’d prefer not to let the limits of your knowledge limit the presentation in the article.
I don’t want to condescend to our readers by assuming that they’re all going to be incapable of understanding how things actually work. I’d like to offer content that builds towards a genuine understanding. To me, that’s what a great article does.
Interjecting my impression: definitely, File:Greenhouse Effect.svg is much more intuitive for readers (intrinsically showing energy flows) and is appropriate for the lead. In contrast, File:Greenhouse Effect Overview.svg requires extensive explanation extrinsically (outside the graphic itself), with the amount of explanation almost certainly being too long and intricate to fit in a conventional image caption. Usually, Wikipedia graphics exemplify or summarize, etc., what's in the text, but File:Greenhouse Effect Overview.svg would reqire text to explain what's in the graphic. There's no rule against that situation; it's just the reverse of the norm. —RCraig09 (talk) 16:31, 13 May 2023 (UTC)Reply[reply]
Top level graphic updated with the insulation wording.
The last 2 paragraphs of the lead of the existing article are built upon the energy flow diagram. The energy flow diagram is foundational to understanding how atmospheric energy flows work, which is why it has stood the test of time in this article and a variant is broadly used in educational materials. There's been many previous discussions about removing or changing it, and each time we come back to it, which is why I focused on updating it.
I don't think Craig or I believe your new diagram is an improvement on it. You are of course welcome to try out a change via the Help:Edit_conflict process. I don't have the energy at the moment to overcome the condescension in your last comment and address the issues of substance you raised. Efbrazil (talk) 18:01, 13 May 2023 (UTC)Reply[reply]
User:RCraig09: Thanks for offering your input, and helping to break a potential stalemate (even if the break doesn't support my preferences).
User:Efbrazil: Thanks for letting me know that you perceived condescension in my last comment; that wasn't my intention. I was feeling rather frustrated with your stance, and not happy with receiving a seemingly unilateral veto. Yet my intention is to always relate respectfully. Sorry if my words didn't land that way for you.
"The last 2 paragraphs of the lead of the existing article are built upon the energy flow diagram." Interesting that you see things that way; I just re-read those paragraphs, and I don't see them as relying on the energy flow diagram in particular, but as referencing concepts that can be thought of in any number of ways.
Craig's argument about wanting an illustration in the lead-in to make sense without too much explanation made some sense to me.
I did run the two illustrations by a friend not steeped in these issues. For what it's worth, she was rather confused by File:Greenhouse Effect.svg, while aspects of File:Greenhouse Effect Overview.svg made sense to her and seemed helpful. So, I suspect the belief that File:Greenhouse Effect.svg is more "intuitive" or easily understood isn't necessarily objective reality, but might be partly reflective of familiarity rather than innate clarity.
By way of feedback, I find File:Greenhouse Effect Overview.svg difficult to grasp because it seems to be part physical diagram, and part graph/chart, in a non-standard way that requires conceptual understanding beyond the diagram itself. Sunlight shines down the physical left side of the diagram, but the bottom of the diagram seems to be the horizontal non-physical axis for temperature; then the brown region at the right ends but is reborn in the upper left, connected by a dark diagonal line that is still a bit mysterious to me (possibly intended as a graph of temperature versus altitude?). The term "lapse rate" is jargon to all but scientists and pilots. Maybe the lapse rate (temperature) and the thermal radiation (of GHGs) could somehow be represented with adjacent gradient colors extending between Earth and space. The legend "...balance sunlight" isn't clear without extrinsic explanation/motivation, and maybe the phrase could be replaced with something like "Earth's temperature without GHGs" if that's correct. (Generally, I think "altitude" is better than the "elevation" that I see in a caption, when speaking of air/atmosphere rather than land formations.) This is just feedback which I hope you take as constructive, as you're tackling a subtle topic with a single diagram. —RCraig09 (talk) 03:42, 14 May 2023 (UTC)Reply[reply]
Thanks for the feedback. I changed "elevation" to "altitude." I had considered putting "lapse rate" in quotes to indicate that it's a technical term which people aren't expected to know off-hand; do you think that would be helpful?
I agree that the figure is a weird composite of graph and diagram. Partly, that's the result of feeling constrained to follow the patterns of existing diagrams, some of which do something similar.
My attention is elsewhere right now. When I find time, maybe I'll think about alternative approaches. Re color gradients to represent temperature and radiation... that's an interesting idea... but I don't yet have sourced data on the radiation flux gradient, just the flow low and high. That's what led User:Efbrazil to object to a object to a prior draft image which arguably didn't suffer from some of the problems of the current image. I do think that older version or something like it could perhaps be justified, if you find it preferable.
The concept of a temperature that emits the radiation flux needed to balance sunlight is really, really central to to whole subject. So, I don't think replacing that sort of wording with words about the "temperature without GHG's" would be a step in the right direction. In my experience, talk of hypotheticals (what it would be like without GHGs) is a show-stopper for some people that reduces their understanding and willingness to believe. The idea of the temperature at which the emission rate balances arriving sunlight may be unfamiliar, but it's less hypothetical, and directly relevant to the physics involved.
Yes, it's hard to capture in a single digram. Rhwentworth (talk) 23:58, 25 May 2023 (UTC)Reply[reply]
A graph showing how temperature has changed or will change at altitude over time could be interesting because it would be another layer of proof and allow us to get into the weeds on lapse rate, but it would be an advanced graphic for the lapse rate article and the modelling section. For instance, see here:
An abstract view like file:Greenhouse Effect Overview.svg doesn't add value that I see though. To go back to the insulation analogy- you could make a similar graph for insulation, showing that since the outer layers of insulation are colder they generate less heat, while the inner layers contain more heat, then introduce terms like lapse rate or R value or whatever. That only confuses an intuitive concept though. Efbrazil (talk) 17:06, 26 May 2023 (UTC)Reply[reply]
I think will be helpful to people's learning if the article clearly separates the issues of (a) how the baseline "natural greenhouse effect" functions to make a planet warmer than its "effective temperature", and (b) how the increasing greenhouse gases and the "enhanced greenhouse effect" increases temperature. I think that until people understand (a), talking about (b) only confuses matters. So, I'd rather not see these topics be intermingled.
The articles you've linked, and your ideas for figures are interesting, and could eventually contribute to some more advance material related to the (b) the "enhanced greenhouse effect." However, personally, my current goal is to get the article to a point where it allows people to understand (a) the baseline "natural greenhouse effect." I think the article still has a long way to go in that regard. For many readers, I see the article not offering them much of a path towards a full understanding.
The figure in file:Greenhouse Effect Overview.svg is a high level summary of a narrative that will need to be expanded upon in order to guide people to a point of understanding the baseline greenhouse effect. We'll see what place in the whole the figure has once that expanded explanation is in place.
Your idea about a hypothetical insulation diagram doesn't make any sense, so, yes, it would only confuse matters.
Your desire to avoid showing things like this for the greenhouse effect, though, presumes the existence of an "intuitive concept" that I doubt exists for many readers. And, even if some readers have an intuitive concept that they are satisfied with, it's important that the article be a resource to readers at multiple levels of knowledge. I don't want to limit it to only including material that is of interest to the least-knowledgeable readers. I'd like it to offer a learning path that increases the level of understanding and knowledge in readers regardless of their initial starting level.
A diagram like file:Greenhouse Effect Overview.svg attempts to share what is one of the simplest ways of understanding the greenhouse effect that is also true, and is aligned with more sophisticated understandings. Perhaps that particular diagram has not yet attained the ideal representation of the idea it's addressing. But, I think there are ideas there that are essential to any real understanding of the greenhouse effect.
A proper exposition may take some time to unfold in the article. I've got other things I need to attend to. Rhwentworth (talk) 08:02, 30 May 2023 (UTC)Reply[reply]
— General observation: since it's difficult to precisely-yet-concisely express what GHGs do, I think it's accurate at a high level to write that "the presence of GHGs has the effect of..." or "GHGs cause...". This observation relates mainly to the high-level, non-techy description in the lead, which is broad enough to be consistent with the techy details without specifying the techy details.
— Articulating the deeper technical distinctions between a broad overview description and a precise techy description is not likely to be important in convincing Marjorie-voters.
— The /* Addressing misconceptions */ section (saying what GHGs don't do) is a step forward in drilling down to techy details. However, in some instances I think it would help if a sentence could be added, immediately saying what GHGs do (immediately after you've stated what they do not do). Such an addition would quickly resolve the misconceptions. Example: saying GHGs "emit more thermal radiation than they absorb" seems intuitively implausible because it doesn't immediately explain where the GHGs get the excess energy to begin with. This is a general suggestion; I'm not critiquing the substance of what you're writing. —RCraig09 (talk) 16:10, 30 May 2023 (UTC)Reply[reply]
Based on your feedback about /* Addressing misconceptions */, I expanded what was said about GHGs offering net cooling. I hope that helps. (I didn't see a useful way to expand on the other points.)
Regarding the voting block you're interested in informing... Some people in that category simply won't believe anything said in the article unless it matches the narrative of their peers. Others pour over every detail of what is said at a technical level, looking for flaws that "prove" the narrative is false. I doubt that much that we write will influence the former. For the latter, I'd like to avoid pouring fuel on the fire, by trying to be reasonably correct and unambiguous without going into so much detail as to overwhelm. At the same time, I'd like the article to be able to help teach those who are sincerely reading to learn.
I'm not quite sure what you mean by "Articulating the deeper technical distinctions between a broad overview description and a precise techy description..."
I'm aligned with the intention, in the lead, to be "consistent with the techy details without specifying the techy details."
There is still work to be done to complete the overall sketch of how the greenhouse effect is caused. But, I like to think that things are progressing overall. Rhwentworth (talk) 06:29, 1 June 2023 (UTC)Reply[reply]
User:Rhwentworth when I said "GHGs emit more thermal radiation than they absorb" seemed implausible, I was imagining you would add a simple sentence that explained that the GHGs gained the apparently "excess" energy from xxx. However, you rewrote the paragraph in a way that was longer, more complex and round-about, and less comprehensible (to me, an engineer) than it was before. I'm hoping, in general, that in this fairly high-level article, you can bridge the gap between your level of understanding and the level of understanding of a typical encyclopedia reader (butcher, baker, candlestick maker). —RCraig09 (talk) 21:30, 1 June 2023 (UTC)Reply[reply]
They added two very sparsely sourced sections at the top on "As a measurable quantity" and "Effect versus cause of the effect", pushing down Concepts and principles.
They also added a large new section called "Concepts and principles: cause of the greenhouse effect" along side the existing section they renamed "Concepts and principles: the greenhouse effect". The new section is focused on lapse rate, which appears to be how their own view of the greenhouse effect is centered. The result, however, appears to be creating an entire second article along side the existing one rather than editing or building on the existing content.
I would like senior editors to step in and say how this situation should be handled. My own view is that this style of editing might be fine for a new article and that many of the edits made are good, but overall the article as it is now is worse than the one of May 28th. If anyone has the time and energy to try and digest all the edits, trim them down, and integrate them into the existing text, they could be constructive. However, it might also just make the most sense to back everything out to that older version:
https://en.wikipedia.org/w/index.php?title=Greenhouse_effect&oldid=1157380106Efbrazil (talk) 17:44, 1 June 2023 (UTC)Reply[reply]
Noting that I'm trying to take a couple-month break from editing CC-related articles due to onwiki stress in this topic. So a bit of a shallow answer, and not watching this page.
Process: Rhwentworth: editing sufficiently slow for others to catch up is really important so that WP:silent consensus can develop. I think there is no consensus apparent on the totality of changes, so the best way forward is a WP:BRD cycle (or BDR) for those pieces where there is disagreement. Copy over the new sections to talk, see which portions have consensus, and then re-add the content which has consensus (probably after improvements)
Content:
Some of the new text is not in Wikipedia's style, talking too directly to the reader rather than being dispassionate. (For instance "is to be distinguished" rather than "is distinguished"
I find the long section title difficult to understand. Usually, a section title shouldn't be longer than 2-3 words (per WP:CONCISE, which also applies to section titles).
I'm not too worried about the citations in the 'As a measurable quantity' section. Those equations are usually sourced to one source. For clarity, it would be good if the source gets repeated once per paragraph
The citations in Effect versus cause of the effect are insufficient. The source is a bit on the old side; is this still how this topic is explained? It's difficult to show something is WP:DUE with one source as well. I would not include this section.
I was just a wee li'l electronics engineer with requisite science background, and I have been overwhelmed by the level of technical detail, and amount of content that has grown the article from 74 to 106 Kbytes in six weeks. I perceive a large gap between the general-audience description in the lead (which is well done) and the seemingly post-doctoral content (in some sections) that is essentially impossible for me to critique in the way Efbrazil urges. If it's intimidating for me (who doesn't even claim to be a Stable Genius), it must be so for much of the general public. As a general approach, I informally propose moving the ultra-techy details (such as those depending on internal links to more arcane techy articles) to a subsidiary article such as Physics of the greenhouse efffect (or similar). —RCraig09 (talk) 21:23, 1 June 2023 (UTC)Reply[reply]
User:Femke: Thanks for your feedback. I've done some further editing to try to address many of the issues that you raised.
(Note that "is to be distinguished" was language taken from the IPCC; nonetheless, I've changed it per your suggestion.)
Regarding WP:ONEDOWN, that may be part of the conflict... My sense is that the "greenhouse effect" is properly a topic for graduate students. So, in keeping with that, I've been writing at a level that I would be comfortable seeing in a class for college freshman. Yet, I have a concern that other editors might want the text to be at about a 9th grade level, which I think would preclude any substantial content. Any advice on how to resolve the issue of what target-level to aim for? In the absence of guidance, I'm worried that could create an impasse.
I'm not sure what age 9th grade or college freshman would be, but I'm thinking the appropriate age for the lead would be about 16, and 18 for the rest of the text. Some elements may need like one year of physics at uni to understand better. I covered this topic at secondary, Bachelor and Master's level, so there is choice.
When deciding on what level to write for, I try to make an estimate of who is coming to Wikipedia for this topic, rather than where the topic is covered. I imagine those going a masters in this topic would have their textbooks for the gritty details. The bigger group would be a general audience, with a few undergraduates. I think a large part of the article should serve them. Femke (alt) (talk) 16:50, 2 June 2023 (UTC)Reply[reply]
User:Rhwentworth In your /* Addressing misconceptions */ section, I see terms that I as an engineer have a vague grasp of and can somewhat distinguish from each other, but I definitely don't think college freshman would be able to readily appreciate or clearly distinguish: "radiation heat transfer", "radiation heat flow", "radiation heat transport", "radiative energy", "thermal radiation", "thermal energy", "radiative surface cooling", "latent heat transport", "thermals (conduction and convection)". Definitely, to understand the narrative here, college students (especially non-physics majors) would have to first study at length the internal links to those other concepts before returning here to assimilate the GHE process in their minds. That is why I have suggested that the exhaustively detailed technical details could be recited in a new sub-article that is linked from here. WP:ONEDOWN should be applied to both this article and the new sub-article. —RCraig09 (talk) 18:16, 2 June 2023 (UTC)Reply[reply]
Thanks for the feedback. I'm thinking about how to simplify (or provide background for) what is said about thermal radiation vs. radiation heat flow so that it's more accessible. These issues are sufficiently important to understanding what is going on physically that it's probably worth trying to find a way to get it right while being clearer, rather than just taking it out. It may take some time for me to find time to sort this out, but it's on my to-do list. Rhwentworth (talk) 06:01, 6 June 2023 (UTC)Reply[reply]
Thanks for the feedback concerning reading level. Makes sense to me. I think that's what I've been aiming for, but your summary will help me keep my eye on that. Rhwentworth (talk) 06:37, 6 June 2023 (UTC)Reply[reply]
In the Greenhouse effect lead, you originally wrote "...cause some of the heat radiated from the planet's surface to be trapped in the lower atmosphere." I changed "in" to "by" and you have now changed the word back to "in."
Let's talk this out.
Why do you prefer the word "in"? I believe "in" to be wrong and misleading.
There is no sense in which heat or thermal energy is being retained inside the air by greenhouse gases, which is what the word "in" suggests.
Instead, heat is being prevented from leaving the surface (or the rate at which heat can leave the surface is being reduced).
As an analogy, suppose you have a tank of water that is being drained by a drain pipe. You then add a liner to the drain pipe that narrows the diameter of the pipe, reducing the rate at which water drains. (Greenhouse gases are like that drain pipe liner.)
You wouldn't say that water is being trapped "in" the pipe (there is actually less water in the pipe after the liner is added); you'd say that water is being trapped in the tank "by" the narrowed pipe.
@Rhwentworth: Sorry, I didn't realize you changed in-->by. I thought I was correcting my own earlier edit when I generalized by saying what GHGs (indirectly) cause rather than what GHGs (directly) do. In any event: all I meant was that the place that the heat is trapped is "in" the lower atmosphere. Using "by" seems to imply that the lower atmosphere causes the heat to be trapped, which is distinct from GHG which is the subject of the sentence. Maybe a solution is to summarize by saying GHGs "cause some of the heat radiated from the planet's surface to be trapped inbuild up in the lower atmosphere". —RCraig09 (talk) 10:11, 3 June 2023 (UTC)Reply[reply]
It's good to know that you weren't deliberately reversing my change without dialog.
Hmmm.
With regard to whether the lower atmosphere or the GHGs are doing the trapping... I think of GHGs are be part of air and giving air some of its properties. In that sense, it IS the lower atmosphere that is doing the trapping. (People seem to often artificially differentiate GHGs from the air that they are a part of in ways that lead them to non-physical conclusions. To me, GHGs are like a dopant in a semiconductor -- they affect the properties of the material, but it's the material as a whole that is doing whatever is done. You can think about things either way, but I find the whole-material perspective helpful.)
With regard to the "place that the heat is trapped," it is not in the lower atmosphere--which is the point I was trying to make with my water-tank-and-drain-pipe analogy. Heat does not build up in the lower atmosphere, or does so only as a secondary effect. It primarily builds up at the surface.
I'll need to think about what a satisfying phrasing could be.Rhwentworth (talk) 17:59, 3 June 2023 (UTC)Reply[reply]
@Rhwentworth: Subtle points indeed. My revised suggestion: The greenhouse effect occurs when greenhouse gases in a planet's atmosphere cause heat to build up at the planet's surface. (or near the planet's surface?) The phrasing is consistent with technical details without reciting those technical details. —RCraig09 (talk) 18:25, 3 June 2023 (UTC)Reply[reply]
I could live with the wording "cause heat to build up at the planet's surface." It's a potentially helpful way of describing things.
(For comparison, the prior wording was: "The greenhouse effect occurs when greenhouse gases in a planet's atmosphere trap some of the heat radiated from the planet's surface." The new proposed wording has the virtue of being less vague.) Rhwentworth (talk) 06:34, 6 June 2023 (UTC)Reply[reply]
In the diagrams being discussed and added in recent weeks, GHGs are always "in the background"--yet they're at the center of the GHE. Would anyone (especially User:Rhwentworth) consider creating a ~simple energy flow diagram that shows the energy inputs and the energy outputs of a single GHG molecule, shown with respective incoming arrows and outgoing arrows? (I picture something similar to the structure of the first diagram on this page.) Such a ~simple energy flow diagram might help to pull together how the GHE operates, because recently created diagrams require considerable study to begin to appreciate. I don't understand the subtleties well enough to even attempt. If this is a bad idea, feel free to ignore! —RCraig09 (talk) 03:09, 4 June 2023 (UTC)Reply[reply]
It's a stimulating suggestion. My first thought is that I don't think anything interesting or supportive of insight happens at the level of an individual molecule. (Maybe I'll change my mind after more consideration. I'd need a clearer motivation for why we would want to include a figure at that level. Maybe a boring figure at that level would be useful at debunking false beliefs that something exotic is going on at that level? What do you imagine happens at that level?)
Interesting things happen at the level of either a thin layer of the atmosphere, or more so at the level of looking how things evolve as you move upward through the atmosphere. (For an example of the latter, as you move upward, the upward thermal radiation energy flux decreases but the upward radiative net heat flux increases. Changes in the downward thermal radiation flux account for the difference. I've got references to support this, and ideas about presentation.)
I think there is potential to adapt some of the figures I've seen to something that would be reasonably clear and useful. Rhwentworth (talk) 06:19, 6 June 2023 (UTC)Reply[reply]
— I was just thinking of an octopus-looking (or starburst) diagram with arrows pointing into and out of (and maybe through) a central hub that is the GHG molecule. The arrows could have appropriate labels along the lines of... "radiation heat transfer", "radiation heat flow", "radiation heat transport", "radiative energy", "thermal radiation", "thermal energy", "latent heat transport", "thermals (conduction and convection)", etc.—whatever is most correct, keeping in mind conservation of energy but showing any imbalances that illustrate what's special about GHGs that underlie the GHE. —RCraig09 (talk) 15:45, 6 June 2023 (UTC)Reply[reply]
— ... but when you write "the upward thermal radiation energy flux decreases but the upward radiative net heat flux increases", I think you'll lose >95% of readers. You're used to talking with other physics PhDs. I think the terms I listed in my 15:45 post would need to be simplified to the level of an inquisitive high school graduate who reads further than the lead. I realize that wording simplification is a challenge. —RCraig09 (talk) 16:03, 6 June 2023 (UTC)Reply[reply]
Heat flow profile of Earth's atmosphere, showing (a) radiative cooling and thermal radiation fluxes, (b) non-radiative heat flow, (c) balance of atmospheric heating and cooling, and (d) temperature profile.
I think it will become considerably easier to explain what is meant about thermal radiation and radiative heat flow using this new figure.
I'll think about whether there could be a complementary figure that would show things at the level of a thin layer of the atmosphere (or possibly at the level of a GHG molecule). But first, I'll need to recover from the substantial effort of generating this figure (albeit based on a great resource I found), and then work on simplifying text in the section you're concerned about. Rhwentworth (talk) 07:23, 7 June 2023 (UTC)Reply[reply]
Over time, I've been gaining a sense (still not a deep understanding) of how the GHE works. File:Atmospheric_heat_flow_profile.svg is a well organized diagram. By way of feedback, I think the major step forward in communicating with non-physics-PhDs is to simplify language—to distinguish in layman's language the various terms in the diagram—remove jargon while still remaining technically accurate. —RCraig09 (talk) 13:31, 7 June 2023 (UTC)Reply[reply]
Examples (verify for precision):
"Heat flow profile of atmosphere" --> "Flow of heat in the atmosphere"
"radiation heat flow upward" --> "radiant heat" with an up-arrow
"downward thermal radiation" --> "radiant heat" with a down-arrow
"decrease in upward thermal radiation" --> "reduction in radiant heat going to space"
"latent heat and thermals" --> "heat flowing through physical contact and motion" with up-arrow
also: small left-arrowhead near "cooling' and small right-arrowhead near "warming"
Good graphic, although it won't be easy to view on smartphone and thumbnail. It could be good for more advanced articles where people are honestly trying to learn, although I don't think it will help in convincing ghe deniers. Things I find confusing:
I am suspicious of how a and b are smooth lines, while graph c shows a lot of variance by altitude. Are a and b based on real data measured at various altitudes, or are they extrapolation based on just 2 or 3 data points?
The third graph doesn't include any greenhouse effect impacts on temperature, I'm not sure why. Shouldn't absorption of radiated heat be a warming input?
For graph a, I could see a denier getting confused by how radiation heat flow upwards is smaller than downward thermal radiation, thinking that violates the second law of thermodynamics
Overall, I confess that I find the data interesting, but not really enlightening in terms of forming a mental model. What I'd most like is 2 graphs side by side, where one shows heat flow or temperature in the atmosphere by altitude without greenhouse gases, the other showing the same thing with greenhouse gases. Efbrazil (talk) 15:44, 7 June 2023 (UTC)Reply[reply]
If the actual GHE itself can't be illustrated, then I agree with Efbrazil that a side-by-side, with-and-without-GHG comparison is also needed. —RCraig09 (talk) 17:01, 7 June 2023 (UTC)Reply[reply]
I understand Efbrazil's concern that the left panel is over-simplified, but I think that such simplifications are what is/are needed in a high-level article. Panel (c) might even be purposely simpified for this reason. A small legend could say "Renderings are simplified for illustration". —RCraig09 (talk) 17:09, 7 June 2023 (UTC)Reply[reply]
@RCraig09 I will look into adding some arrows as appropriate. Your language which is intended to simplify actually makes clarity much more difficult. You're proposing referring to "thermal radiation" as "radiant heat", yet the main distinction that is helpful to get is that "thermal radiation" is NOT heat. Your suggestion would confuse that issue. One simplification I have made is to try to consistently use the same phrases, rather than varying the wording different times that a concept is referred to. I can probably implement the suggestion of refraining from using the word "profile." (It means that we are talking about variation with altitude, as oppose to transverse variations, but I suppose it is ok for that to go unsaid in this context.)
(a), (b), (c) and (d) are all from the same data-set and are mutually consistent. Chart (c) shows the derivative with respect to height (with an added adjustment related to density) of the curves in (a) and (b), which is why it is a bit jagged while (a) and (b) are smooth. I agree that this point might be confusing. The jaggedness is likely a numerical artifact rather than a real phenomenon. So, I will look into artificially smoothing the jaggedness in (c), consistent with what RCraig09 suggested.
In principle, I could add an "absorption" curve on the right in (c) and an "emissions" curve on the left. That would (i) complicate the diagram, and (ii) change the scale so that latent heat and solar warming would be dwarfed to insignificance in comparison. Instead, I've chosen to show the "net effect of absorption and emission". Perhaps it would be helpful to add a label to that effect? Contrary to your lead-in to this point, I don't see any sense in which this would be a "greenhouse effect impact on temperature" even if it was included. It's more an example of a misconception about how the greenhouse effect functions (albeit not clear enough to be worth addressing in the article).
There are endless opportunities for deniers to misunderstand anything that is said or shown. I believe that any confusion about radiation down being larger than heat up (but not radiation up) is a second-order issue, less significant the the primary confusion (a failure to distinguish heat and radiation) that the diagram is trying to help clarify. I don't see a way of heading off this possible confusion without adding unnecessary complication that would increase rather than decrease confusion.
The current diagram has a purpose of illuminating certain specific misconceptions. It doesn't have a primary purpose of explaining how the greenhouse effect makes things warmer. A separate diagram would likely be helpful for that, although it could use components of the current diagram, e.g., chart (a). I agree that a side-by-side comparison would likely be useful. (I'm somewhat amused by the suggestion, insofar as in earlier discussions I proposed side-by-side comparisons and you continually objected that such comparison was unnecessary. But, perhaps the context is now different.)
Thanks for the feedback. I'll add some "to-do" tasks to my list. Rhwentworth (talk) 18:55, 7 June 2023 (UTC)Reply[reply]
Thanks, User:Rhwentworth, for clarifying the misunderstandings in my verify-for-precision suggestions above; I do think a simpler term for "thermal radiation" is needed, making it understandable in a high-level article. Yes, the context is different: explaining the GHE in general versus showing energy flow more specifically. —RCraig09 (talk) 19:07, 7 June 2023 (UTC)Reply[reply]
I've updated the diagram, with numerical artifacts smoothed away, arrows, etc.
Standard alternatives to "thermal radiation" include "longwave radiation", "terrestrial radiation", "thermal infrared", or longer combinations of these words. If you try to use something "friendlier" than that, you risk using non-standard language and being vague or technically wrong. I started out not liking "thermal radiation", but Efbrazil was arguing for it at one point as being widely used, and the term has grown on me.
"Latent heat" could be called "phase change" -- or "evaporation/condensation" or "evaporation" in the context of the surface or (perhaps) "condensation" in the context of the atmosphere. I've used "evaporation" in other contexts, when focused on heat flow at the surface. In this context... I don't see the alternatives to "latent heat" as being better. None of the options seems likely to be understood without explanation. And, given that an explanation is available, it's useful for people to learn the term "latent heat" because it is a concise very standard term with a well-defined meaning. ("Latent heat" is currently defined in article, near where the figure appears.)
I'm amused that you distinguish "the GHE in general versus showing energy flow more specifically", since the only explanations of the GHE that I'm aware of are either terminally vague or involve energy flows. Rhwentworth (talk) 00:33, 8 June 2023 (UTC)Reply[reply]
Thanks! For this chart, I see value in graphs A and D but not graphs B and C in describing the GHE. For the GHE we should be focused on thermal radiation, but you dismiss it by saying that absorption and emission are offsetting. However, the same could be said for sunlight- all the heat the planet absorbs from the sun it radiates outwards, it's just that it partitions into different forms in the atmosphere, and that's all that graph B and C talk about.
Graphs A and D are somewhat useful for describing how the GHE raises temperature. Graph C could be cut or changed to only focused on thermal radiation, and instead of having offsetting warming and cooling it could just be a graph showing thermal radiation activity by altitude (where activity is rate of emission + absorption). Efbrazil (talk) 17:36, 8 June 2023 (UTC)Reply[reply]
You are ignoring the context of what this particular chart, File:Atmospheric heat flow profile.svg, was created for. It was not created to illustrate how the GHE causes warming. It is meant to accompany the discussion of misconceptions about the effects of GHGs. Chart (c) supports discussion of a misconception that GHG's "warm the air"—something that they do not do, except very indirectly (at the level of whole-planet equilibrium). What actually happens is that non-radiative heat sources and sunlight heat the air, and GHGs cool the air. Chart (c) addresses the specific purpose of illustrating that fact. Chart (b) exists to help support understanding of chart (c).
Your comment seems to be about what should or should not be in a different figure which would exist to support understanding of how the GHE warms the planet.
You questioned why I would seem uninterested in the partition between emission and absorption, when I am bothering to plot the partition between energy from sunlight and non-radiative heat flow vs. radiative heat flow. The difference I see is one of one of what moves energy from place to place. Sunlight and non-radiative heat flow move energy between different locations in the atmosphere. In contrast, it is only the net effect of emission and absorption that is involved in moving energy between different locations in the atmosphere.
Even if it were meaningful, a plot of "thermal activity by altitude" would be difficult to present in a meaningful way. If one plotted "rate of emission" and "rate of absorption" as separate curves, those two curves would be visually indistinguishable. They differ by perhaps 1 percent. That's why chart (c) only shows the difference between those two curves, as a "net effect."
You seem to have some ideas about how greenhouse effect warming happens, ones which you would like to see illustrated? However, you are not being explicit enough about your reasoning for me to be able to know what you mean. So far, I don't see why you would want the plot you are suggesting. Could you explain in what way you believe such a plot (if only it were possible present effectively) might be meaningful? Rhwentworth (talk) 20:33, 8 June 2023 (UTC)Reply[reply]
This version might include too much information. All that is needed is the upward thermal radiation. Including downward thermal radiation and net radiative heat flow are unnecessary distractions that probably confuse matters.
Though both Versions 1 and 2 still haves jargon, Version 2 is most readily understood—if a caption provides an explanation of what "thermal radiation" is and how it differs from what Everyman understands. If you want to achieve an exhaustively technically accurate presentation, this entire process must be a progressive education of the reader from the simple to the complex. It's expected that you'll lose progressively larger portions of the readership as you proceed. Much of what you're doing is at such a level of technical detail that it will never matter to the lay reader of a high level article. Version 2 with a helpful caption is a good "early chapter" of the explanation. —RCraig09 (talk) 06:04, 8 June 2023 (UTC)Reply[reply]
Sourcing of each diagram is another consideration. —RCraig09 (talk) 06:12, 8 June 2023 (UTC)Reply[reply]
One source is this page from the University of Chicago. With appropriate parameter settings, it yields both the "with GHE" and "without GHE" curves. (To get the "without GHE" curve, one must adjust the surface temperature until there is no overall energy imbalance.) Rhwentworth (talk) 20:48, 8 June 2023 (UTC)Reply[reply]
I like version 2, although I'm not sure it is correct because it looks like you are comparing the planet without any atmosphere to one where there is an atmosphere. Even without greenhouse gases, wouldn't the atmosphere still provide a slight insulating effect due to stuff like convection and conduction with the surface? I understand it's tricky as the planet would freeze over and block latent heat transfer. I guess that's partly why people are so confused by Snowball Earth- between albedo and latent heat transfer how did the planet ever escape that state?
Also, I would cut the word flux and I think it's just as good, with the top label just saying "Thermal radiation" and the bottom saying "Temperature".
I also think labeling the white part of the diagram as the "greenhouse effect" is confusing. It seems like it should be the curved colored part, since that is where the extra heat is. Efbrazil (talk) 17:48, 8 June 2023 (UTC)Reply[reply]
The "no GHE" diagram does include an atmosphere, albeit one without GHGs or clouds. In the absence of these, no, the atmosphere does NOT provide any insulating effect. This is because it is only GHGs and clouds that prevent every bit of the thermal radiation emitted by the surface from reaching space. Convection and conduction in the atmosphere would be irrelevant to that fact.
It the absence of GHGs and clouds, convection and conduction don't affect planetary radiative equilibrium no matter what they do. But, if you're curious about what happens to convection in the no-GHE case, it's as follows:
Convection and atmospheric circulation would be very weak. In the with-GHE atmosphere, what drives convection and atmospheric circulation is the temperature difference between the "heat source" at the surface (where sunlight is being absorbed) and the "heat sink" at a high altitude where GHGs are emitting thermal radiation to space. In the no-GHE case, that heat sink is absent. The only heat sink is the cooler surface in the polar regions. The temperature difference between the tropics and the poles would be much less effective at driving atmospheric circulation (compared to the temperature difference between low and high altitudes in the with-GHE case).
All that the weak convection and conduction would do is transport heat from the tropics toward the polar regions. They would move heat laterally over the surface of the globe, but would play no role in moving heat to space (which is a role that they serve in an atmosphere with GHGs).
As for how Earth escaped a snowball state, I think the leading hypothesis is that a series of massive volcanic events introduced enough CO2 to initiate a non-frozen climate.
One thing that people have trouble thinking about is that illustrations like sub-chart (b) reflect a scenario in which the greenhouse effect is gone, but other things (i.e., planetary albedo) are unchanged. People seem to have trouble dealing with that sort of abstract hypothetical. They get hung up on thinking about things changing practice, if one could really get rid of GHGs, and get confused.
Thats why I often prefer to simply compare the surface temperature to the planetary "effective temperature"; that involves no hypotheticals (and is what scientists calculate in practice). Though, it does require understanding the significance of the planetary effective temperature (the temperature needed to emit enough thermal radiation to balance sunlight), so there is no easy way of making things clear to everyone.
As an alternative, it can also be useful to look at an instantaneous no-GHE scenario: What would happen if the Earth was in its current state, and one magically turned off the ability of CO2, water vapor, and clouds to absorb thermal radiation? Then, you would suddenly have a diagram like chart (b) but with an upward flux of 398 W/m². This would instantly create an energy imbalance, with planetary cooling exceeding planetary warming by a massive 158 W/m² (i.e., the size of the greenhouse effect). This massive imbalance would rapidly lower temperatures. The end state wouldn't be the classic -18℃ because Earth's albedo would change. However, it's clear that things would get much colder. This way of talking about things has the advantage that it involves an instantaneous hypothetical, not a hypothetical equilibrium state in which one is temped to think about all the different factors which would be different.
It's tricky to explain greenhouse effect warming in a way that people "get it." Rhwentworth (talk) 21:39, 8 June 2023 (UTC)Reply[reply]
The amount of volcanic activity required to break the snowball earth state is hard to imagine. It's off topic but interesting to consider, as it's one of those big mysteries in science that really hasn't been figured out.
I read up some more and I think you are right about all the insulating effect of the atmosphere coming from greenhouse gases. Amusingly, chatgpt disagreed, but I was able to convince it otherwise. I think it's possibly an interesting point to get across- that the earth without greenhouse gases would be the same temperature as the earth without any atmosphere at all.
I maintain that your graphics will be much more intuitive if you point to the extra heat near the surface as being the greenhouse effect, instead of describing the dead space above the extra heat as the greenhouse effect. Maybe I'll take a crack at that if you don't. Efbrazil (talk) 18:20, 9 June 2023 (UTC)Reply[reply]
Comparison of Earth's upward flow of infrared thermal radiation in reality and in a hypothetical scenario in which greenhouse gases and clouds are removed or lose their ability to absorb thermal radiation—without changing Earth's albedo (i.e., reflection/absorption of sunlight). Top shows the balance between Earth's heating and cooling as measured at the top of the atmosphere (TOA). Panel (a) shows the real situation with an active greenhouse effect. Panel (b) shows the situation immediately after absorption stops; all thermal radiation emitted by the surface would reach space; there would be more cooling (via thermal radiation emitted to space) than warming (from sunlight). This imbalance would lead to a rapid temperature drop. Panel (c) shows the final stable steady-state result, after the surface cools sufficiently to emit only enough thermal radiation to match the energy flow from absorbed sunlight. The amount of thermal radiation emitted by the surface depends on its temperature. I've integrated the discussion thus far and produced a figure File:Outgoing radiation with and without Greenhouse effect.svg I've tried to make it clearer that the greenhouse effect is neither the white space nor the blue, but simply the difference between what is emitted and what reaches space. I've also simplified the language in the X-axis labels.
You're definitely accumulating quite portfolio of thoughtful graphics! I don't mean to add to your workload, but to represent evolving physical scenarios, one could use [[GIF]s (GIMP is free), though some in this community dislike GIFs for being distracting. —RCraig09 (talk) 03:25, 9 June 2023 (UTC)Reply[reply]
@RCraig09: Regarding GIFs... Thanks for the suggestion. However, I am among those who find GIFs to be too distracting to want to include them directly in an article. I wish there was a way to cause them to animate only when requested, but I don't see such a capability being available. Rhwentworth (talk) 20:06, 11 June 2023 (UTC)Reply[reply]
We have 3 surface temperatures in these graphs- the 15 C of the Earth now, the -20C of the earth without an atmosphere, and then a set point of about -100C for what the earth would be without sunlight at all. However, the Earth would be the temperature of outer space in that case, right? More like -400C, not -100C. What am I missing? Efbrazil (talk) 19:41, 10 June 2023 (UTC)Reply[reply]
What you are missing is that the bottom scale is very non-linear. So, you're misinterpreting if you think the graph indicates a set point of about -100℃ without sunlight. It doesn't.
The temperature of outer space is 3K or -270℃. I have added that to the scale in the figure.
Does that help?
I appreciate you pointing this out so that the point could be clarified in the diagram.
(Note that -18℃ doesn't require no atmosphere; it simply requires no greenhouse gases or clouds, i.e., no absorption of thermal radiation in the atmosphere.) --Rhwentworth (talk) 20:40, 10 June 2023 (UTC)Reply[reply]
Thanks, that makes more sense, although it raises another point of confusion for me. You are saying that the greenhouse effect as a measurable quantity is suppressing 40% of thermal radiation escaping to space, but that the temperature effect is only a matter of going from -18C to 15C, which is obviously a lot less than a 40% increase given a baseline of close to -270C. Put another way, if the temperature impact was a 40% increase on top of going from -270C to -18C, then Earth's surface temperature would be about 89C. Can you explain to me the discrepancy? Is there a way to relate the two numbers? Efbrazil (talk) 02:06, 11 June 2023 (UTC)Reply[reply]
Plot shows the temperature needed to emit a given amount of thermal radiation
If one expects the relationships to be linear, then nothing will make sense. The actual relationships are fairly simple, if highly non-linear.
The power emitted at the surface is , so the radiation flux changes about 4 times as fast as temperature does.
The formula for the surface effective temperature, , relative to the power outgoing to space, is
where OLR is outgoing longwave radiation, σ is the Stefan-Boltzmann constant, and is the normalized greenhouse effect.
For , , and .
So, a 40% suppression of radiation raises the surface temperature by 14%.
Temperature needs to be given in Kelvin, for all this to work. The Kelvin temperature is 273.15 + temperature in Celsius.
Thanks, that's a fantastic explanation! I see the information in the section on "as a measurable quantity" too. The graph is very helpful for seeing the relationship. Efbrazil (talk) 19:40, 11 June 2023 (UTC)Reply[reply]
I've put the temperature vs. radiation plot into the "as a measurable quantity" section too, to help others see the relationship as well. Rhwentworth (talk) 20:37, 11 June 2023 (UTC)Reply[reply]
I created an image that is viewable on smartphone / thumbnail and tries to get the idea across more clearly. Let me know what you think. I could upload to wikimedia and put in the article if you like, or you could take some of the graphical ideas in here:
User:Efbrazil I like the directness and simplicity of your 20:06 drawing (especially the circular arrows that resemble those in the GHE drawing that was prominent for so long, and which capture the circular ~interception of energy). I'll leave it to others to verify the numbers on the horizontal axis, and I'm not sure what "heat without atmosphere" conveys; should it be "temperature without atmosphere"? But regardless, this diagram will help new readers to understand, assuming a concise caption is drafted. (Maybe Fahrenheit could be added, for the English-language encyclopedia.) —RCraig09 (talk) 21:02, 11 June 2023 (UTC)Reply[reply]
Intriguing. I generally like the figure. And... I'd like to spend some time mulling over the nuances.
Some details that stimulate unease in me:
Labeling the range -270 to -18℃ as "Heat from sunlight" plays into a common source of confusion. It suggests that sunlight contributes that much energy, and the rest of the energy somehow magically is supplied by greenhouse gases. In truth, ever bit of the energy involved comes from sunlight. So, I find this particular label deeply problematic. That temperature range is actually something more like "Temperature without 'blanket' effect of greenhouse gases". But, that's probably too long to meet your needs.
You've labeled the upward radiation that is cancelled by downward radiation as "Thermal radiation intercepted by greenhouse gases." I'm still mulling over whether I think that's an accurate and fitting label. It might be. Still pondering.
You've drawn the radiative interface between space and the atmosphere as being at 20 km. In practice, that's a decent approximation, and is sometimes used. However, serious work often considers a higher boundary, such as 70 km. That's why my diagram just talked about energy balance at "top-of-atmosphere" without specifying exactly where that was. I have a slight nervousness that a climate skeptic might object that the whole atmosphere is not being considered, based on a drawing that shows the boundary at 20 km. I'm not sure if this is an issue that matters or not.
At the moment, #1 is my most serious concern.
I'll ponder including some of these ideas in my version of the diagram. Rhwentworth (talk) 21:02, 11 June 2023 (UTC)Reply[reply]
Much concern could be avoided if the numerical altitude scale and the numerical "Energy flow" scale simply omitted the numbers. Readers here don't care about exact numbers (especially Watts/m^2). Probably the numeric temperature scale should remain, as temprature is directly meaningful to humans (Fahrenheit to Yanks ;-) ). —RCraig09 (talk) 21:13, 11 June 2023 (UTC)Reply[reply]
Perhaps numbers for altitude could be omitted.
But, I like including numbers for energy flow, for a number of reasons:
Articles about the greenhouse effect and radiative forcing are constantly referring to energy flow numbers, so it's good for people to get a sense about the size of these numbers.
People often mistakenly treat temperature and "heat" as interchangeable in ways that are deeply confused, and which lead to false conclusions. I like to keep it clear how these two things are distinct. Including numbers supports that.
Without a scale for energy flow, it's not apparent how intensely nonlinear the relationship is between temperature and energy flow. Failure to appreciate that often leads to false reasoning.
@Efbrazil: If you include Farenheit, that creates a minor headache with regarding how to label the left-most temperature.
Is that label meant to be the temperature to emit no radiation, i.e., absolute zero, 0 K / -273℃ / -460℉, or is it meant to be the temperature without sunlight, i.e., the temperature of space, 3 K / 270℃ / -454℉? When we're dealing with Celsius, one can sort of finesse this issue, and say that we're just going to offer 2-significant digits for temperature, in which case the result is the same, either way.
(Technically, the top panel of "Warming" includes "Warming from the 3K microwave background radiation" -- but that amount is completely negligible compared to the intensity of sunlight. Including that would resolve any apparent contractions, but at the expense of introducing a confusing complication. It would hurt more than it helps, for most people.) Rhwentworth (talk) 21:36, 11 June 2023 (UTC)Reply[reply]
Microdetail: since the center curved-triangle involves heat capture (warming), it could be reddish, to distinguish from blue cooling on the left side of the diagram. —RCraig09 (talk) 21:19, 11 June 2023 (UTC)Reply[reply]
To be rigorous and pedantic: the curved triangle represents radiation being intercepted, not "heat." That radiation interception prevents the radiation from being "heat flow" (or net energy transfer).
But, it's generally true that the phenomenon in that region contributes to warming. Rhwentworth (talk) 21:26, 11 June 2023 (UTC)Reply[reply]
I agree with @RCraig09 that "Heat without atmosphere" is confusing. We're not really drawing "heat", except in certain portions of the diagram. I'd prefer "Temp. w/out greenhouse gases".
There is a common false belief among some climate skeptics that the atmosphere causes warming but that warming has nothing to do with greenhouse gases. (They think it's simply atmospheric "pressure", though that's based on muddled thinking about the physics.) So, I prefer to focus on the comparison of with-and-without greenhouse gases, rather than with-and-without atmosphere. Rhwentworth (talk) 21:15, 11 June 2023 (UTC)Reply[reply]
Thanks for the encouragement! I also modified my graphic as per what was said above:
Labels: I updated the labels at the bottom describing temperatures to work in isolation and to include what I think is all the critiques above. I still would like to somehow say that "no greenhouse gases" produces the same result as "no atmosphere", but that's probably not the place to say that.
Triangle color: The triangle is still showing thermal radiation, it is just showing it moving in a different direction, so I kept the colors the same. However, I think it's fair to say the color shouldn't be blue all the way, since that implies cooling purely. I went to a red to blue gradient, to clue people into the temperature at altitude.
Altitude labels: I left them as I don't want to get too hand wavy with the graphic. If people think it's really not correct to make the cutoff at 20 km then I'm not sure what to do, as I'd need to squish the triangle to fit, and then the triangle label wouldn't fit...
The color shading you've chosen does convey that it's warmer near the surface than it is higher up. But, there's a certain loss in not differentiating the coloring of the regions. You say "it's fair to say the color shouldn't be blue all the way, since that implies cooling purely"... well, if you were coloring the net-energy/heat-flow portion to the left, that is, in fact, purely cooling. You write that the triangle is "still showing thermal radiation, it is just showing it moving in a different direction"... that's one way of thinking about it; but I think it's more accurate to say that that region represents the portion of upward radiation that is being counterbalanced or canceled by downward radiation, so that there is an absence of a cooling effect. That's why I chose to make that area a lighter blue in my diagram. One could use a warm color if you equate an absence of cooling to warming. But, perhaps the lighter blue would more closely match what the region represents? I'm not sure if I'd prefer separate colors for the regions over you use of color to represent air temperature -- but I'd kind of like to see it both ways. ADDED: You could convey both if you do a gradient in both places, but increase transparency in the triangle, so it's a lighter version of the gradient?
If you're unable to do superscripts in your tool, you could use a unicode superscript character to indicate square meters: ² I wouldn't want to see ^2 in the final version.
A technical detail is that without the Sun, geothermal energy (about 0.08 W/m²) would raise Earth's surface temperature to very roughly 34 K / -239℃. So, the current label isn't entirely correct, technically. It's really "≈ -239℃ if only geothermal energy". Maybe one could use -240℃ to imply only 2-significant digits are being used. Not sure how that should be handled... Though it's a complication, it could be useful to acknowledge geothermal this way, since a common climate denial trope is that geothermal energy is responsible for climate change--when it's really way too small for that.
If you upload it, please use a more specific title than "Thermal flow". That's too generic a term to claim with a specialized figure.
I changed the colors to be light blue for the cooling area and gray to indicate neutrality for the greenhouse effect area, since in that area there is no directional flow. I also made it clear that the up arrows are flowing from not just the surface, but also from the thermal radiation intercepted by the greenhouse gases. Both changes I'm not wedded to, if you prefer the gradient or having the up arrows only at the top then let me know.
Superscript fixed
I changed the bottom axis labels again, this time to just explain the two temperatures that matter: -18C and 15C. One reason is to make it clear that the axis is not describing what's in the chart, since I don't want people thinking that the right side of the chart is higher temperatures. Secondly, I don't think we need to focus on the temperature of the Earth without a sun, that opens up a can of worms, like geothermal energy and steady state, and of course the Earth wouldn't have formed without the sun, so how far back are we going in establishing steady state?
Title will change when uploading
Take a look and see if concerns are addressed. Same location:
Thumbs up on the 18:57 version! (except, maybe removing absolute altitude numerals that aren't useful to the layman and aren't accurate enough for the scientific purist) —RCraig09 (talk) 19:11, 12 June 2023 (UTC)Reply[reply]
It's continuing to improve.
The visual style is a bit flat and dull-seeming; that's not fatal, but... The use of gradient might help with that? I'm thinking returning to the idea of a gradient from warm to cool, but making the gradient different in the two regions to differentiate them. I had envisioned using the the same gradient in both sections, then overlaying the triangle with a partially transparent white layer to mute the gradient there. I wanted to demonstrate that, but am not yet competent at GIMP, so I produced https://climatepuzzles.org/wp-content/uploads/2023/06/GHEThermalFlow-alt1.png instead, which perhaps has its own interesting qualities. (That version arose from overlaying a partially transparent gradient over the existing colors.) Probably, what I wanted to do would better differentiate the two regions? Ultimately, this point is about aesthetics without detracting from clarity--I'm not sure how to optimize it.
The one thing I would consider changing about the labels is that I might consider changing the one label to "Cooling: Net thermal radiation to space". The reason it might be helpful to add "Net" is that that's what differentiates the two regions of the figure. The region to the left is "net" upward radiative thermal energy flow, and the region to the right is the upward thermal radiation flow that is cancelled out by an equal downward flow. Adding the word "net" offers a clue to what the diagram actually means, without, I hope, unduly complicating matters.
Otherwise, labeling now seems pretty good.
I'm okay with the choice to retain altitude numbers.
Gradients! I say Gradients! Gradients for the win! —RCraig09 (talk) 00:06, 13 June 2023 (UTC)Reply[reply]
The addition of two separate gradients adds confusion for me, as I want to know what the gradients mean. If the gradient means temperature of the atmosphere at altitude then the colors between the two areas should be the same. If the color means directional flow of energy then there should only be 2 colors- light blue vs gray- as it is now.
I think the light blue and gray make the most sense since that's the central point of the diagram. The simplicity doesn't bother me, since this is primarily for smartphone and thumbnail. This is not meant to be a graphic you need to zoom into to understand.
I'm also not sure about adding "Net" to "thermal radiation to space". I personally find that more confusing than helpful. If we wanted to show up flow / down flow cancelling each other out on the right hand side then that's where we should do it- in the triangular area. I'll give it some thought... Efbrazil (talk) 00:20, 13 June 2023 (UTC)Reply[reply]
The circular arrows already denote the two flows canceling each other out. I'm not sure if the background could try to indicate that without adding confusion. I thought of suggesting a warm color for the triangle, but upon thinking about the warming effect being indirect rather than direct, I'm actually liking the choice of a neutral gray for that area, with color reserved for the actual direct warming and cooling. Rhwentworth (talk) 04:04, 13 June 2023 (UTC)Reply[reply]
Good! Graphic live on the page now, second in lead. I moved down the existing graphic to the "simplified models" area. I also changed "intercepted" to "trapped", which I think is perhaps more descriptive and common terminology. It also suggests an accumulation of infrared radiation, which I like. Efbrazil (talk) 16:37, 13 June 2023 (UTC)Reply[reply]
I like the graphic and the placement.
However, I dislike the shift from "intercepted" to "trapped." To the extent that the idea of "trapping" is valid, it usually refers to thermal energy being trapped at the surface, unable to efficiently move upward towards space.
The idea of radiation being "trapped" seems dubious and likely to generate confusion and argument. Radiation isn't something that can be contained, except via mirrors (which are not present in the atmosphere). Instead, radiation is intercepted/blocked/absorbed/destroyed. Nor is radiation a conserved quantity which could somehow "accumulate." It's thermal energy that accumulates; radiation levels only increase as a side-effect of that energy accumulation.
Claiming that "radiation is trapped" also feeds into standard tropes of climate deniers, who routinely present explanations of how this couldn't possibly be true. That problem is bad enough when it's said that heat is trapped; implying that radiation is trapped is likely to aggravate matters.
So, I request a return to the use of "intercepted" in the diagram. The wording may be less familiar, but it's more accurate, and less prone to stimulating misunderstanding and resistance. Rhwentworth (talk) 20:55, 13 June 2023 (UTC)Reply[reply]
I went with "absorbed" for now, as that arguably splits the difference between intercepted and trapped. The advantage of absorbed is that it makes it clear what the greenhouse gases are doing and why there is more heat in that area- the accumulation of energy. Intercepted just means two things connect with each other so it's kind of meaningless in forming a mental model. If you really don't like absorbed we can go back to intercepted. I also zoomed the graphic a tiny bit in the process (trimming back white space around it). Efbrazil (talk) 16:30, 14 June 2023 (UTC)Reply[reply]
"Absorbed" is an interesting choice. Technically, the amount of radiation absorbed is in some ways more than what is in the grey triangle. I'm not sure off-hand how one would properly plot the amount "absorbed" on this type of diagram. But, the triangle likely shows what is absorbed without being replaced by an equivalent amount being emitted upward? So, the gray triangle is what is "effectively absorbed", I think? So, maybe "absorbed" is close enough to being true to live with, at the level of discourse offered by the diagram. I'll mull over a bit more. Okay for now.
(What the triangle really represents is upward radiation cancelled out or negated by greenhouse gases sending an equivalent amount of radiation downward, so that there is no contribution to net energy transfer. But, I can't think of a one-word way of encapsulating that which would be at all clear.)
Ah, I see what you mean by absorbed not conforming to the energy quantity the graph is showing. I changed absorbed to redirected, I think that's more technically correct, particularly as it is coupled with the circling arrow thing. So it now says "Thermal radiation redirected by greenhouse gases". Good? Efbrazil (talk) 20:31, 14 June 2023 (UTC)Reply[reply]
@RCraig09@Efbrazil: I am wondering if it might make sense to prefer using the term "thermal infrared" instead of the term "thermal radiation", as our term for consistently referring to this phenomenon? Here are some arguments in favor of this possible change:
The term "infrared" is familiar to many people. Perhaps "thermal infrared" would seem less unfamiliar/mysterious than the term "thermal radiation"?
The term "thermal radiation" is not one of the equivalent terms listed by the IPCC in their glossary. That glossary lists as equivalent terms longwave radiation, thermal infrared, and terrestrial radiation. Among those choices, I think "terrestrial radiation" is too long, and "longwave radiation" is less intuitively meaningful than "thermal infrared".
Although some sources use the term "thermal radiation" in the way that we've been using it, technically the term Thermal radiation refers to any radiation emitted as a result of temperature; thus, sunlight is also "thermal radiation." So, our usage of the term to mean only longwave thermal radiation is technically inaccurate. I suspect that is why the IPCC does not include the term in their list of synonyms. You need an additional qualifier to make the term accurate. Thus, "thermal infrared radiation" or "infrared thermal radiation" or "longwave thermal radiation" are technically correct, if verbose.
When one says "infrared", arguably "radiation" is implicit, so perhaps we can omit the the word "radiation". That serves conciseness, and perhaps reduces mention of "radiation", which others has argued to be an off-putting term.
I'm not committed to this being a necessary change, but I wonder if it might help. Thoughts?
AFTERTHOUGHT: Since the word "thermal" distinguishes longwave from shortwave radiation only in informal usage, I'm realizing that "thermal infrared" is no more technically correct than is the term "thermal radiation." So, this issue is really only one of which term might be more comfortable for article readers to encounter.
Avoiding talking about this phenomenon altogether is not a viable option within an article about the greenhouse effect; it's the phenomenon that the greenhouse effect depends on and is all about. So, readers fundamentally need to learn this concept, if they are going to do more than glance at the article. The article does define this concept, and offers synonyms, in the section "Longwave vs. shortwave radiation." Rhwentworth (talk) 22:38, 8 June 2023 (UTC)Reply[reply]
As an expedient, is it proper to use "infrared" by itself? It's a common word for non-techies. ("Radiation" invokes thoughts of Hiroshima, Chernobyl, and Star Trek.) —RCraig09 (talk) 02:40, 9 June 2023 (UTC)Reply[reply]
My preference is thermal radiation or longwave radiation. We have to explain radiation to differentiate from other types of heat transfer, and then we need to clarify the type of radiation to distinguish it from sunlight. I don't like just infrared on its own and it's inaccurate, and I expect most people visiting the article also won't know what infrared means.
I also think it's good for us to be consistent and use the same term everywhere. It takes some explaining to define the term, so we shouldn't confuse things by popping around between different terms. Efbrazil (talk) 18:09, 9 June 2023 (UTC)Reply[reply]
I'm all for consistency of terms. Choose the correct term that is the least jargony, and explain any jargony term upon its first usage, rather than merely wiki-liking to it. —RCraig09 (talk) 21:34, 9 June 2023 (UTC)Reply[reply]
@RCraig09 You seem to be repeatedly admonishing us to "Choose the correct term that is the least jargony, and explain any jargony term upon its first usage, rather than merely wiki-liking to it" — yet it appears to me that we are already generally doing that.
In most cases where we wiki-link something, it is also explained somewhere nearby. I'm happy to have you point out any exceptions to that.
We explain the term "thermal radiation" in more than one place. (Wiki-linking the term "thermal radiation" is actually problematic, because the link takes one to an article which reveals that "thermal radiation" is in general not limited to being longwave infrared radiation.)
On balance, "thermal radiation" currently feels like the "least jargony" alternative we have.
"Longwave radiation" is more technically correct, and is what I see most used in the technical literature. Also, it's referred to in terms like "outgoing longwave radiation" (OLR). So, there could be an argument for switching to that, to ensure full consistency. I'd be willing to switch to "longwave radiation" if others supported the idea. But it's probably (?) less friendly-sounding and intuitive than "thermal radiation"? Rhwentworth (talk) 20:14, 10 June 2023 (UTC)Reply[reply]
Apologies: I've intended it as a goal, not an admonishment of failure. I was hoping the article would flow more smoothly for lay readers who would read the article sequentially, wanting to minimize side trips to other articles. I think one subsidiary article is best for most of the 50% growth this article has seen (I will discuss below today or Sunday). —RCraig09 (talk) 22:22, 10 June 2023 (UTC)Reply[reply]
While some people refer to "infrared radiation" when talking about the greenhouse effect, this tends to contribute to confusion. A greenhouse effect denier will say "They say greenhouse gases let sunlight through but absorb infrared, but sunlight is 49% infrared, so they are wrong—greenhouse gases absorb sunlight." The bit about sunlight being 49% infrared is correct, but the idea that this means greenhouse gases absorb that infrared is wrong. This false logic even made it into a flawed scientific journal article that somehow got published.
I think it's important to use a term that distinguishes what we are talking about from sunlight, and the term "infrared radiation" doesn't do that. Rhwentworth (talk) 18:51, 11 June 2023 (UTC)Reply[reply]
I am consolidating the article to longwave radiation. It works best as a general term for several reasons:
Suggestion: [[Physics Scientific principles underlying the greenhouse effect]][edit]
Step back from this process and take pause. In both graphics and textual explanations, we seem to agree it's hard ("tricky") to convey the GHE to lay readers.
I perceive that this article's 72-->108 KB (50%) growth in length since late March, and its dizzying increase in complexity, are hurting, not helping, that readership. Much of what has been recently added overcomes subtle technical misconceptions that lay readers couldn't possibly have had the depth of understanding to suffer from, in the first place. Many additions are essay-like constructions, and may violate WP:SYNTH, as briefly discussed above.
In this high-level article with almost 1500 views/day (almost half of Climate change's views), the IPCC definition could be presented, and then explained in layman's terms in a few hundred words. If a jargon term is necessary, it should be explained at its first usage and not merely wiki-linked. Such an approach had been basically accomplished in the /*Definition*/ and /*Principles*/ sections in the ~March version. The lead has already been ~successfully adapted to a broad readership in a similar manner.
In contrast, subtle distinctions or lengthy technical embellishments requiring even technical readers to study concepts in other technical articles, should be placed in a subsidiary article that would of course be linked from this article. Suggestion: Physics (Physical?) principles underlying the greenhouse effect. I hope we don't lose sight of the fact that this article is for its readers. —RCraig09 (talk) 03:15, 9 June 2023 (UTC)Reply[reply]
I can conceive of splitting off a separate Physics of the greenhouse effect article. There are, no doubt, different categories of readers who would be served by material at different levels. I hope we don't lose sight of the fact that not all readers have the same needs.
You and I apparently have very different opinions of the article as it was in late March. I assess that as being a surprisingly low-quality article for such an important topic. The coverage seems uneven in level and lacking in insight, editorial balance, and overall coherence. If I wanted someone to learn about the greenhouse effect, I would not be comfortable referring them to that, no matter what their educational level might be.
So, if the article was split up, the main article would still need a lot of work, in my view. Rhwentworth (talk) 09:06, 9 June 2023 (UTC)Reply[reply]
Certainly the quality, including balance and consistency, of the March version could be improved. My 03:15 post mainly concerned the technical level of this high level (~1500 views/day) article. Certainly this article isn't being visited by 1500 physics majors per day. Article quality could have been improved in the same manner the lead quality has been improved, without increasing size with exhaustive technical minutiae. What's left now is largely impenetrable to >95% of readers. —RCraig09 (talk) 15:01, 9 June 2023 (UTC)Reply[reply]
As an alternative to creating a separate article, perhaps we could divide the article into an initial "Non-technical overview" section and a "Technical information" section? Perhaps that would help the article serve multiple readerships? Rhwentworth (talk) 20:57, 10 June 2023 (UTC)Reply[reply]
Let me elaborate on the suggestion.
Currently, most sections of the article after the "History" section offer a mix of non-technical and technical information. This was true even before I began editing. Trying to have individual paragraphs be both understandable to non-technical readers and useful to technically-knowledgeable readers likely poorly serves both audiences. So, covering topics at both a non-technical level and a technical level, and doing so separately, could potentially better serve both audiences.
This could be done be creating a separate Greenhouse effect (technical) article. However, moving towards separating the content within the current article would be a less drastic, more incremental step. So, I think it would be preferable.
Even if a separate Greenhouse effect (technical) article was eventually split off, starting out by simply partitioning the current article would help making any eventual two articles more mutually consistent and coherent.
I could envision an initial outline something like the following:
History
Non-technical overview
Definition
Principles, etc. (this would likely take more than one subsection, even at a non-technical level)
Atmospheric components
Role in climate change
Bodies other than Earth (might just say that there is an effect on Venus, Mars, and Titan)
Technical definition (currently called "as a measurable quantity)
This would then be followed by the other current sections, initially largely as-is.
Conceptually, I'd ideally want to put the later sections in an overall "technical information section." However, that would hamper readability and navigation, because Wikipedia formatting doesn't provide easy visual distinctions between 2nd and 3rd level subsections. The technical material benefits from being broken up into subsections, to organize the material.
The subsections of the "Non-technical overview" would provide whatever can be conveyed without getting too technical. Material that requires more background would be in the later sections, available to more motivated readers and more knowledgeable readers.
— I think strongly that the ultra-techy details need a separate article. The "dramatic change" you refer to has already occurred: the number of Sections+Subsections has grown from 13 in the March version to 35 today, while the article byte length has increased by 50%.
— Much of the new content doesn't merely describe the GHE itself (as expected in an encyclopedia), but also why it works this way and not that way, and sometimes argues against misconceptions some people might have. It's like a technical essay—sometimes with something to prove—not an encyclopedia article. It's too much. Please take a moment to look at Britannica's GHE article. This is what ordinary people read. (P.S. Britannica uses "infrared radiation".)
— I agree that "covering topics at both a non-technical level and a technical level, and doing so separately" would indeed serve both laymen and experts. Beginning as early as /*As a measurable quantity*/, the text already dives somewhat densly into formulas, techy terms, and the dreaded Greek letters. To keep both layman's text and techy diversions in the same article would probably balloon the number of (sub)sections even further. It's dizzying to survey this article as it is. Also, an illustration is supposed to be illustrative (ideally not requiring explanations outside the illustration itself), so any complicated diagrams should migrate to the subsidiary article.
— For these reasons, I think it would be best if you remove much of the May-June content and create a new article with a suitable title like Physics of the greenhouse effect and then edit it, Warp 10 if you like. You could edit (not so much expand) the present article so it's consistent with the techy details without delving into the techy details. One test: Ask your Amazon guy or bowling buddy to look at it for a few moments, and see the reaction.
— FYI Re article naming: In the huge ~2019 Global warming --> Climate change + Climate variability and change renaming discussion (skirmish, actually), parenthetic phrases in titles were discussed and discarded. On Wikipedia, parenthetic phrases in titles are almost always used to disambiguate different things that have the same name, as in Mercury (element), Mercury (planet) and Mercury (mythology). To name something Greenhouse effect (technical) would imply the main article Greenhouse effect is about a different subject, which it's not.
— I don't mean to discourage your contributions. I think it's a matter of appropriateness for the lay audience of a general encyclopedia. —RCraig09 (talk) 04:05, 11 June 2023 (UTC)Reply[reply]
It's not generically true that all Wikipedia articles are, or should be, non-technical. Many Wikipedia articles cover topics that are inherently technical, and those articles often delve extensively into technical details, including equations, greek symbols, specialized mathematical symbols, technical jargon, and so on. The technical content in the current "greenhouse effect" article is much less technical than the content in many Wikipedia articles I've read. (I do have a predilection for reading more technical articles.)
So, I wish you wouldn't make your arguments in a way that suggests that Wikipedia/encyclopedia articles should in general be at a particular level, or that Wikipedia readers are all served by a particular level of presentation.
It depends on the subject.
The greenhouse effect is somewhat unusual in that it is a subject that is ultimately inherently technical, yet also has a high level of interest from readers without a technical background. (In addition, in my experience, there is also a substantial middle-ground of readers with no technical background but who nonetheless want to understand the technical details of everything related to climate change.)
I hope we are in agreement that it would be desirable to find a way to serve well both non-technical and technical readers who are interested in the greenhouse effect?
# # #
The question is how to do so.
I'm not opposed to creating two separate articles.
However, as a matter of how to get from here to there, I would find it much more do-able and less stressful to apply an incremental approach.
Towards that end, I suggest following through with the suggestion to start by re-organizing the current article to separate and fill out non-technical and technical content. That would set things up for a graceful transition to having two separate articles. The alternative would be to first make two separate articles, then engage in a mad dash to clean up the mess that has been made in both articles are a result of the premature split. I don't relish such a process.
Are you willing for us to start with this, by creating an non-technical overview section that would be a container for the non-technical content?
# # #
I take your point, with regard to the convention for the use of parenthesis in article titles.
Previously, I thought a title like "Physics of the greenhouse effect" might work. However, reviewing the article (even as it was before I started editing), I see technical content throughout that isn't quite right for a non-technical reader, and the technical content isn't necessarily specifically about the physics. So, I'm wondering what an appropriate title would be. Maybe Technical aspects of the greenhouse effect? Seems a bit awkward, but generally points towards what is needed. Alternate ideas?
Perhaps an appropriate name might become more apparent once the non-technical and technical content of the current article has been separated? Rhwentworth (talk) 22:24, 11 June 2023 (UTC)Reply[reply]
— I definitely don't think all Wikipedia articles should be non-technical. I expect formulas when I click on quantum physics. However, the present 1500 view/day article, which explains what underlies about the most pressing crisis for the planet, should be readily accessible for the general public at the level of Britannica's GHE article.
— Here, most of the recently added science will be largely impenetrable to the layman, who will have trouble understanding or seeing how the numerous sections interrelate. I show some of the new graphics below in hopes you will get an impression of how laymen—probably at least 90% of incoming readers—would soon be lost (even techies would find it challenging since this is not a formally "science encyclopedia"). The boundary between "non-techy" and "too techy" should result in this parent article being concise and without technical digressions and arguments and arguments that would be dizzying to laymen.
— An encyclopedia article would normally describe what a subject is. However, here, some additions add different slants: why surface and outgoing fluxes differ, why the GHE doesn't work the way you suspect some think it might work, etc. That's where it resembles an essay, not an encyclopedia article. Tellingly, much of /*Addressing misconceptions*/ is vaguely sourced to entire books without specific pages or passages, which is WP:SYNTH essay-like (see WP:NOTESSAY), especially when apparently no source is cited to describe the italicized statements as misconceptions in the first place.
— Seeing your 22:24 comments, I suggest a title, Scientific principles underlying the greenhouse effect or similar, mentioning science rather than "technical..." which is often interchanged with technology.
— As you would be the one spearheading the work, I acquiesce in whatever process you choose, but the results should hopefully be the same. —RCraig09 (talk) 04:41, 12 June 2023 (UTC)Reply[reply]
How about Science of the greenhouse effect as a title? Rhwentworth (talk) 00:17, 13 June 2023 (UTC)Reply[reply]
After that, I don't know that a separate article is necessary. Climate change is 9687 words, this article is now 7480 words, so length isn't the key issue. The issue is complexity of concepts. The lead should always be accessible to a middle schooler or anyone completely unfamiliar with the material and looking only at their smartphone. I'd try to maintain that standard through the first half of the article if possible. Articles can be more advanced towards the end.
I think what I'd do is try to reorganize the article by complexity, with mathy stuff and advanced graphics at the end in a clearly labeled more advanced section (maybe "Physics of the greenhouse effect"). That particularly means pulling mathy stuff out of "As a measurable quantity", "Greenhouse effect and temperature", and "Radiative balance".
I could take a crack at that unless Rhwentworth does first. Efbrazil (talk) 17:36, 13 June 2023 (UTC)Reply[reply]
Good point re taking "misconceptions" to the Talk Page. Moving the hairy-thermodynamics-content down is the least one should do in a general-audience encyclopedia, but if it's done smoothly, with the audience constantly in mind, I could acquiesce. Since the CC article is one of the most important articles on the entire website, I don't think a Kbyte-size comparison to CC is appropriate; something more like the way quantum physics article has subsidiary articles Mathematical formulation of quantum mechanics and Applications of quantum mechanics is appropriate. —RCraig09 (talk) 19:51, 13 June 2023 (UTC)Reply[reply]
I'm working on the transition to separating less technical and more technical material. I expect it to be an iterative process. First steps will be coming soon, but that won't be the final state. Rhwentworth (talk) 22:13, 13 June 2023 (UTC)Reply[reply]
Things are looking signficantly better now, thanks! I very much like having the greek letters sequestered to one section. Let us know when you're getting close to being done editing and I will go over things in more detail. We might also want to tighten things up, maybe by trimming down the greenhouse gases section, since there's already an article clearly dedicated to that topic. Efbrazil (talk) 16:12, 15 June 2023 (UTC)Reply[reply]
I'm done with major edits for the moment. I trimmed the greenhouse gas section. Rhwentworth (talk) 04:16, 17 June 2023 (UTC)Reply[reply]
Merci bien for le ping. User:EfbrazilUser:Rhwentworth Because the /*Definition*/ section closely follows the lead and /*History*/ sections, I've just boldly condensed and re-organized and simplified it for the lay reader, re-naming it /*Measurement*/ because that's what almost all of the content pertained to. I purposely omitted the bodaciously-scary-to-the-common-man-but-not-adequately-explained-afterward IPCC definition as being more appropriate to the techy sections below. —RCraig09 (talk) 04:15, 18 June 2023 (UTC)Reply[reply]
I took a readability pass down to the point of "greenhouse gases", will hopefully continue tomorrow. Efbrazil (talk) 19:19, 20 June 2023 (UTC)Reply[reply]
Caption for File:Greenhouse effect with energy flows shown by altitude.svg[edit]
After my edit, the caption was: "Energy flows down from the sun and up from the Earth. Greenhouse gases intercept some of the thermal radiation emitted by the surface, preventing it from having a cooling effect. This causes surface temperatures to rise."
After an edit by @RCraig09 this became: "Energy flows down from the sun and up from the Earth. Greenhouse gases intercept some of the thermal radiation emitted by the surface, preventing it from escaping into space, thus causing surface temperatures to rise."
I had a very specific reason for writing "preventing it from having a cooling effect" rather than "preventing it from escaping into space":
The grey triangle in the diagram shows the region where downward radiation cancels out upward radiation. This is the portion of the upward radiation that does not contribute to radiative heat transfer (net energy flow), i.e., does not contribute to radiative cooling.
What is "prevented from escaping to space" is the portion of upward radiation to the right of of the 240 W/m2, the heating due to absorbed sunlight. That quantity is not called out or clearly identified in the figure (which is okay, given the intention of the figure).
So, your wording change changes a reference that describes the grey triangle into a reference that describes something else (something depicted only implicitly), leaving it more of a mystery what the grey triangle really corresponds to.
While many viewers won't understand things well enough to differentiate the two ideas, my way of labeling things would be more technically correct, and could help a reader who is trying to really make sense out of the diagram.
So, I'd like to go back to my wording, or something close to it. Rhwentworth (talk) 03:13, 14 June 2023 (UTC)Reply[reply]
File:Greenhouse effect with energy flows shown by altitude.svg
My (substantive) problem was with the wording "Greenhouse gases intercept some of the thermal radiation emitted by the surface, preventing it from having a cooling effect." The "it" is ambiguous, in context—not clearly referring to the GHGs or to thermal radiation. Further, adding the concept of "cooling effect" complicated the description unnecessarily (and confuses readers who arrive having heard only of global warming). If you have a substantive scientific understanding that supervenes, please go ahead and revise the caption (with your Amazon delivery guy in mind), but please be aware of the language issues involved. —RCraig09 (talk) 03:24, 14 June 2023 (UTC)Reply[reply]
@Efbrazil: I'm worried that your July 5 edit to the caption of the flows-by-altitude graphic suggests that GHGs cause the entire 33°C temperature increase, and that the temperature numbers aren't accurate or consistent. Suggestion for last sentence: When greenhouse gases intercept radiation emitted by Earth's surface, they redirect it in randomall directions and cause the heat to build up as shown, resulting inthe current surface temperature s rising byto about 3315 °C (9159 °F).... Does this make more sense? —RCraig09 (talk) 06:32, 6 July 2023 (UTC)Reply[reply]
The suggestion is true- it's a 33 C rise. From -18C to 15C. 15 - -18 = 33. Efbrazil (talk) 17:20, 6 July 2023 (UTC)Reply[reply]
There are a few goals here:
Not be redundant with the first caption or lead text
Really speak to the diagram
I think it's good to call out the 33 C rise, as that is what greenhouse gases are causing
So, to go back to your text, I'm fine with some of the edits. Maybe this rewrite works:
Energy flows coming down from the sun and up from the Earth and its atmosphere offset each other. The gray area shows greenhouse gases that have intercepted longwave radiation and are redirecting it in all directions, so there is no net flow. This trapped heat causes Earth's surface temperatures to rise by about 33 °C (91 °F). Efbrazil (talk) 18:26, 6 July 2023 (UTC)Reply[reply]
Eek! The 18:26 proposal is radically different, and is much less intuitive for laymen. "Offset" is a conceptual abstraction that many laymen won't quickly understand or readily apply to the diagram. The language doesn't explain, "no net flow..." ... of what? (in laymen's terms) There is no antecedent in the caption for "This trapped heat". Most importantly, a 33 °C rise is not the same as a 91 °F rise. From the diagram, it looks like GHGs add 15, not 33, degrees. My 06:32 proposal sought to simplify the explanation of the diagram for a reader seeing it for the first time, and make the temperature figures accurate and consistent. —RCraig09 (talk) 19:05, 6 July 2023 (UTC)Reply[reply]
I see what you mean about the conversion, I just fixed that on the live page, thanks for finding that (I needed to use c-change in the conversion template).
The wording you have up above is just a restatement of what is already said elsewhere in the lead. What I think we need to do is speak to the diagram itself. Let's look for a middle ground between what I wrote and what you wrote. How about this. It is clearly an image caption, it makes no sense without it, and doesn't restate information already in the diagram (like the temperature change):
Energy flows coming down from the sun and up from the Earth and its atmosphere cancel each other out. The gray area shows longwave radiation that is flowing in all directions after greenhouse gases have absorbed and redirected radiation emitted by Earth's surface. Efbrazil (talk) 20:14, 6 July 2023 (UTC)Reply[reply]
The lead is almost 350 words long (too long for some!), and it's 100% OK, even preferable, to repeat the important parts of text in lead images and their captions (both lead text and lead images are supposed to summarize the topic). I've just made non-substantive changes to the actual caption, thinking it should retain temperature numbers—which in this case are in the diagram—and "closing the (conceptual) loop". Saying "energy flows" offset/cancel each other etc. is counterproductive because it seems to suggest to new readers (or those that only look at the pictures) that nothing could possibly cause the planet to warm. —RCraig09 (talk) 20:55, 6 July 2023 (UTC)Reply[reply]
In my edits, I'm trying to channel some of what rhwentworth brought to the content, as they are not taking part in this edit process. I understand your concern about saying cancel out, and it only cancels out when in a steady state. I'm ok leaving the image caption as it currently is. Efbrazil (talk) 15:42, 7 July 2023 (UTC)Reply[reply]
I'm not entirely enjoying the changes to the caption:
Prior caption: Energy flows down from the sun and up from the Earth. Greenhouse gases intercept some of the longwave radiation emitted by the surface, preventing it from escaping into space, thus causing surface temperatures to rise.
Current caption: Energy flows down from the sun and up from the Earth and its atmosphere. When greenhouse gases intercept radiation emitted by Earth's surface, they redirect it in all directions and cause heat to build up. This heating results in surface temperatures being about 33 °C (59 °F) warmer.
The narrative about "redirecting" radiation is a lousy, misleading, problematic narrative, even it's a widespread one.
I'm willing to tolerate a little use of this narrative, as a concession to how familiar it is. But, I'd prefer to avoid repeating this narrative any more than absolutely necessary, because I think it's a counter-productive way of thinking about things, producing more misunderstanding than understanding.
The narrative has already been offered in the caption to the first figure. I'd really like the narrative offered in the caption for the second figure to be a step towards something a little closer to the being scientifically accurate and meaningful.
The "redirection" of radiation narrative is problematic because:
It suggests a fictitious connection between absorption and emission of thermal radiation; in reality, absorption and emissions are actually independent processes which have very little to do with one another. There is little if any inherent relationship between the amount of radiation absorbed and the amount emitted, contrary to what the narrative suggests.
It emphasizes a way of thinking about energy flows that is easily misinterpreted as violating the 2nd Law of Thermodynamics (which says that heat only flows from warm to cold); resolving that misunderstanding requires making distinctions that most readers aren't up to making. So, it seems best to simply avoid that emphasizing that way of thinking about energy flows.
It encourages falling into the "surface budget fallacy" in which one focuses on energy flows at the surface, rather than energy balance at TOA. Focusing on energy flows at the surface is very tricky to get right, and leads to erroneous conclusions more often than not, which is why such a focus has been labelled a "fallacy." Focusing on TOA energy balance leads to reasoning which is simpler, more rigorous, and more reliably correct.
I prefer the prior wording because it avoids the 3 problems above, while being simple and correct.
# # #
Regarding the subject of energy flows "cancelling"... That seems like a useful concept to me. Energy levels and temperatures change only to the extent that there is incomplete cancellation:
The Earth warms because the energy leaving is slightly less than the energy arriving.
Radiative thermal energy moves upward only to the extent that the flow of upward longwave radiation is greater than the flow of downward longwave radiation. That's exactly what the figure depicts: the gray area is the upward flow of longwave radiation that is "cancelled" by a matching flow of downward longwave radiation; the blue area is the upward flow of longwave radiation with no matching/canceling/counter-balancing flow of downward longwave radiation.
You may or may not want to try to explain this to readers, but it's fundamental to what the figure is actually plotting. Rhwentworth (talk) 04:16, 9 July 2023 (UTC)Reply[reply]
File:Greenhouse effect with energy flows shown by altitude.svg
Spending (by MS Word's tally) 458 words to explain what is wrong with a 48-word caption, shows an attempt to anticipate more possible misinterpretations along abstruse lines that >90% of readers will never be capable of distinguishing. Lead text and images are supposed to be summaries for a layman's understanding; here, they're backed up by a now-dizzying set of over a dozen overlapping-concept technical diagrams that only a tiny fraction of Wikipedia readers will ever bother to tackle. A specific, non-jargon solution of under ~50 words is definitely needed, preferably one that concisely explains what's behind global warming. —RCraig09 (talk) 05:02, 9 July 2023 (UTC)Reply[reply]
Those words are intended to support my co-editors in having a better understanding of the topic they are editing. To my mind, the standards for that are different than the standards for what actually ends up in the article.
I disagree that these are merely "possible misinterpretations along abstruse lines." Rather, I perceive these as extremely common misinterpretations (which are all but inevitable if all one ever reads is that sort of "explanation").
The original caption ("Greenhouse gases intercept some of the longwave radiation emitted by the surface, preventing it from escaping into space, thus causing surface temperatures to rise.") was under 50 words, and to my mind is a more accurate explanation than the longer one that currently appears in the caption.
I'm merely asking that the initial explanations not double-down on repeating the same rather poor "explanation", but offer some diversity in a direction that points towards better explanations.
The "redirects radiation" explanation is ONLY a surface explanation; serious explanations don't tend to expand on that. I think the use of such superficial explanations which can't sustain close scrutiny is a factor in the level of greenhouse effect denial that exists.Rhwentworth (talk) 06:26, 9 July 2023 (UTC)Reply[reply]
— I've made some changes to the caption, intended to avoid the technical reasons for "why" or "how" GHGs work, but still explaining "what" they do. I think they'll meet with everyone's approval.
— Separately: is it meaningful to ask what the temperature is at the left side of the blue shaft? (We know the right side is -18 °C; what about the left?). I know we don't want to explain that question in the caption, but I was wondering about where the left side of the gray triangle should intersect the horizontal axis. No long explanations are necessary; just confirm that the present diagram is correct. —RCraig09 (talk) 05:53, 12 July 2023 (UTC)Reply[reply]
Thanks for making those changes to the text.
The point where the left side of the gray triangle intersects the horizontal axis is "close enough" to where it belongs for the diagram to serve its purpose.
Explanations you don't need:
It was a deliberate choice to not indicate a temperature for the left side of the blue shaft, i.e., the left side of the diagram, because it is complicated to talk about. (Per discussion earlier on this page, one could make arguments for the label being -273, -270, or -239℃; including any of these values would require explanation that isn't really helpful to the main point of the diagram.) It's more meaningful to say that the left edge corresponds to ~0 W/m2. Deviations from exactly zero are why there is some ambiguity to the temperature there.
The left side of the gray triangle doesn't correspond to a temperature in any way that is physically meaningful. That intersection point does correspond to a meaningful energy flux value. But, that value isn't worth explaining to readers. (The value depicted in the diagram, ~80 W/m2, is a bit higher than the real global average, 56 W/m2, but does correspond to a value that would exist in certain scenarios, and was the output of a particular climate model. So, the diagram as drawn is good enough to serve its intended purpose.)
Confusing claim that "Greenhouse gases cool the air, since they emit more radiation than they absorb"[edit]
Text in "Radiative effects" section said: Greenhouse gases cool the air, since they emit more radiation than they absorb. Air is warmed by latent heat (buoyant water vapor condensing into water droplets and releasing heat), thermals (warm air rising from below), and by sunlight being absorbed in the atmosphere. Warming from these sources supplies the energy which allows greenhouse gases to emit more radiation than they absorb.
First, it is confusing to lead with "Greenhouse gases cool the air", but that can be fixed with wording. More substantially, I don't know that the claim is correct for all greenhouse gases. Greenhouse gases that absorb longwave radiation will transfer energy to other molecules prior to it being emitted. Also, emissivity and absorptivity of a molecule can vary based on the wavelength of radiation, or temperature of the air. It all adds up to confusion for me, and it seems possible that there is a particular greenhouse gas at a particular atmospheric layer may take in more energy than it emits.
For now I simply omitted the information from the article, so that it now speaks in terms of the atmosphere as a whole. If there is a good source on the matter I'd like to see it. Efbrazil (talk) 18:03, 21 June 2023 (UTC)Reply[reply]
This section may be related to the apparently-implausible statement that I questioned in the discussion leading to this diff: "GHGs emit more thermal radiation than they absorb". —RCraig09 (talk) 19:13, 21 June 2023 (UTC)Reply[reply]
Yep, sounds like the same point. I believe what Rhwentworth is saying is generally correct- that the air is heated by ways other than radiation (including convection and phase change), whereas it cools only through radiation. Therefor, on balance, the atmosphere emits more radiation than it absorbs.
However, where I get fuzzy is in the absorptivity vs emissivity of specific gas types. It may be correct for all greenhouse gas types, but I couldn't find supporting documentation of that claim. Efbrazil (talk) 20:00, 21 June 2023 (UTC)Reply[reply]
The references that were cited in the article in connection with that claim do support the claim. One reference is a textbook, which I have, but which is admittedly not very accessible to those without a copy of the book. The other reference is the journal article Manabe (1964). See figure 8b, which shows the longwave and shortwave effects of different gases as different altitudes.
As can be seen from that figure, the longwave effect is almost always a net cooling effect—and the effect is uniformly a cooling effect within the troposphere.
The only modest exception is in the case of ozone, which has a slight longwave warming effect in the stratosphere. That anomaly is a result of the concentration of ozone being dramatically higher at those altitudes; the ozone layer absorbs thermal radiation from below that wasn't being absorbed at lower altitudes, resulting in modest warming via absorption of longwave radiation. Note that the scale of the chart is temperature change, not energy. At high altitudes, it takes very little energy to heat or cool the thin gas. So, that ozone longwave heating effect is a very small effect if one considers its effect on energy flow.
All that business about ozone is at a much finer level of detail than the general level of discussion in the article. So, I don't think there is any need to go into those details. We can simply go with wording similar to what was being said, i.e., "Greenhouse gases cool the air, since they emit more radiation than they absorb." If necessary, we can add a qualifier, e.g., "they generally emit more radiation..." or "...in the troposphere" or something like that. But, as a broad statement, the words are pretty accurate even without a qualifier. Rhwentworth (talk) 21:54, 8 July 2023 (UTC)Reply[reply]
The first sentence is good, but the second sentence and what follows doesn't flow from the first sentence- it reads like a completely separate paragraph. That makes the whole thing hard to read.
We also neglect to mention how starlight is shortwave radiation in contrast to longwave radiation from the planet. I think that's good to clarify as that's the key property of greenhouse gases- they allow shortwave through but block longwave. Without saying that, we are allowing confusion to new readers, for instance they could think light is not radiation. Here's a suggested rewrite:
The greenhouse effect occurs when greenhouse gases in a planet's atmosphere cause some of the heat radiated from the planet's surface to build up at the planet's surface. This process happens because stars emit shortwave radiation that passes through greenhouse gases, but planets emit longwave radiation that is partly absorbed by greenhouse gases. That difference reduces the rate at which a planet can cool off in response to being warmed by its host star. Adding to greenhouse gases further reduces the rate a planet emits radiation to space, raising its average surface temperature. Efbrazil (talk) 17:28, 27 June 2023 (UTC)Reply[reply]
Overall I think it's a definite improvement. I've long perceived that the present intro digresses to explain some underlying background principles. Your suggestion overcomes that awkwardness by describing the GHE in a single progression of concepts. Minor observations:
First sentence: We've had discussions as to whether it's truly "heat" that's radiated from a planet's surfact.
"This..." (alone) isn't a good subject of a sentence, grammatically. Maybe "This phenomenon..." or "This process..." could be used (two instances of "This..." occur).
The second phrase of the second sentence seems to imply that GHGs absorb all LW radiation.
I also changed the third paragraph and swapped it with the fourth paragraph as I noticed that the first paragraph rewrite overlapped with it. It now covers new territory, but the basic idea is the same- to further ground the physics that the first paragraph introduces. I went live with the change because I think it was necessary to eliminate the redundancies. Efbrazil (talk) 17:49, 29 June 2023 (UTC)Reply[reply]
As per your comment in the last article edit, I swapped the third and fourth paragraphs of the lead because the greenhouse paragraph introduces the idea of radiation and concludes with a sentence that transitions nicely into talking about radiation wavelengths. Having them the other way around there was no logical flow. Efbrazil (talk) 19:41, 29 June 2023 (UTC)Reply[reply]
Ok, I'm out of ideas for now RCraig09. I understand the last 2 paragraphs of the lead are a bit awkward, but I think they are very valuable as a pathway to really understanding the basics of the greenhouse effect. I hate explanations that just say "trust the experts", and I also hate explanations that fall back on jargon and equations. Everything should be made clear and simple enough for someone to really understand what's going on. Let me know if you have further thoughts. Efbrazil (talk) 17:22, 30 June 2023 (UTC)Reply[reply]
What I wrote in my 29 June edit comment to the main article was more an observation than a call to action. I think the lead can stay as is—subject to periodic improvements ;-). —RCraig09 (talk) 06:12, 1 July 2023 (UTC)Reply[reply]
I don't think that this section on real greenhouses is still needed in this article now. I've moved a small part of it to the "terminology" section. If someone wants to read up on real greenhouses, they can click on the hyperlink there. It is not the purpose of this article to explain how a real greenhouse works (my opinion). Here is the text that I deleted:
A greenhouse is built of any material that passes sunlight: usually glass or plastic. The sun warms the ground and contents inside just like the outside, and these then warm the air. Outside, the warm air near the surface rises and mixes with cooler air aloft, keeping the temperature lower than inside, where the air continues to heat up because it is confined within the greenhouse. This can be demonstrated by opening a small window near the roof of a greenhouse: the temperature will drop considerably. It was demonstrated experimentally (R. W. Wood, 1909) that a (not heated) "greenhouse" with a cover of rock salt (which is transparent to infrared) heats up an enclosure similarly to one with a glass cover.[1] Thus greenhouses work primarily by preventing convective cooling.[2]
Heated greenhouses are yet another matter: as they have an internal source of heating, it is desirable to minimize the amount of heat leaking out by radiative cooling. This can be done through the use of adequate glazing.[3]
It is possible in theory to build a greenhouse that lowers its thermal emissivity during dark hours;[4] such a greenhouse would trap heat by two different physical mechanisms, combining multiple greenhouse effects, one of which more closely resembles the atmospheric mechanism, rendering the misnomer debate moot. EMsmile (talk) 22:14, 6 July 2023 (UTC)Reply[reply]
References
^Wood, R.W. (1909). "Note on the Theory of the Greenhouse". Philosophical Magazine. 17 (98): 319–320. doi:10.1080/14786440208636602. Archived from the original on 7 August 2011. Retrieved 23 January 2005. When exposed to sunlight the temperature rose gradually to 65 °C., the enclosure covered with the salt plate keeping a little ahead of the other because it transmitted the longer waves from the Sun, which were stopped by the glass. In order to eliminate this action the sunlight was first passed through a glass plate." "it is clear that the rock-salt plate is capable of transmitting practically all of it, while the glass plate stops it entirely. This shows us that the loss of temperature of the ground by radiation is very small in comparison to the loss by convection, in other words that we gain very little from the circumstance that the radiation is trapped.
^
Schroeder, Daniel V. (2000). An introduction to thermal physics. Addison-Wesley. pp. 305–7. ISBN978-0-321-27779-4. ... this mechanism is called the greenhouse effect, even though most greenhouses depend primarily on a different mechanism (namely, limiting convective cooling).
^Darrin, Ann (2000). "Variable emissivity through MEMS technology". ITHERM 2000. The Seventh Intersociety Conference on Thermal and Thermomechanical Phenomena in Electronic Systems (Cat. No.00CH37069). pp. 264–270. doi:10.1109/ITHERM.2000.866834. hdl:2060/20000089965. ISBN0-7803-5912-7. S2CID109389129. Archived from the original on 24 June 2018. Retrieved 7 January 2021. Specialized thermal control coatings, which can passively or actively adjust their emissivity offer an attractive solution to these [spacecraft] design challenges.
In general, I think this is a good change structurally, but I don't think it is helpful to characterize it as a misnomer. The prior language in the lead did a better job of shedding light on how heat transfers. I'll look to make subsequent edits that fix the regressions I'm seeing. Efbrazil (talk) 15:09, 7 July 2023 (UTC)Reply[reply]
Thanks, I like your changes to the terminology section a lot. So just to be sure I understand: this misnomer thing is/was a minority view and not worth mentioning here at all? Or could it be worth saying "some say it was a misnomer but others dispute this because..." (or not worth saying if it's got only tiny representation in the literature). EMsmile (talk) 18:06, 7 July 2023 (UTC)Reply[reply]
Great! The general flow of the debate before is that the greenhouse analogy is not perfect but also not bad on an intuitive level. In either case the sun's heat is being retained. The thought was that it is better to clarify the analogy than it is to characterize it as wrong or a misnomer. Efbrazil (talk) 20:46, 7 July 2023 (UTC)Reply[reply]
@EMsmile, @Efbrazil: I think the elimination of the section on real greenhouses is an improvement, particularly after the subsequent collaborative edits. Thanks. Rhwentworth (talk) 02:47, 9 July 2023 (UTC)Reply[reply]
How to organize explanations (reverted changes leading to "Modeling atmospheric layers")[edit]
I reverted two changes by @Efbrazil that led to a section being labeled "Modeling atmospheric layers." Those changes resulted in a wildly inappropriate section heading, and, to my mind, damaged the logical flow of the sequence of ideas:
Most of the material in the section that ended up with the label "Modeling atmospheric layers" had little if anything to do with atmospheric layers, at most mentioning the a "layer" as something purely conceptual and incidental to expressing some primary idea. None of the material in the section describes "modeling" of layers. Modeling the atmosphere using discrete layers is a distinct thing in climate modeling, and the contents ended up under that heading have very little to do with that sort of modeling.
The changes moved some text labels "Reduced heat loss" into a position of introducing the rest of the material in the "layers" section. However, that material labeled "reduced heat loss" is really orphan material, a legacy of earlier version of the article. It's material that might arguably be helpful to include in some way. But, it's NOT a good match to the other material in the section, being part of a fundamentally different narrative. Placing it in an introductory position confuses and undermines the subsequent material rather than supporting it.
I perceive the sections involved, which have been reverted to the headings "Simplified models" and "Why surface and outgoing emissions differ" as being immature and in need of further elaboration, organization, and improvement.
But, I don't see that particular attempt at improving matters as having been successful.
If it's important to make changes here, perhaps you could name what objectives you'd like such changes to attend to? Rhwentworth (talk) 02:44, 9 July 2023 (UTC)Reply[reply]
I folded the section on "Reduced heat loss" up into the longwave radiation section, and day night as an add on into that area. As you said, the content was just orphaned where it was. It's also simple, introductory content, so it belongs higher up in the article.
"Why surface and outgoing emissions differ" is really the whole point of the article, so having an individual section titled that doesn't work. Section titles need to describe what, specifically, is going to be in the section. My reading of that section is that it is really focused on the lapse rate and effects at altitude, so for now I simply raised up the title of "Lapse rate". Efbrazil (talk) 00:56, 14 July 2023 (UTC)Reply[reply]
There are two categories of narrative about the greenhouse effect: surface-energy-flow narratives and top-of-atmosphere (TOA) energy balance narratives. The surface energy budget narratives are so often problematic that one prominent climate textbook (Principles of Planetary Climate by Pierrehumbert) refers to undue focus on such narratives as the "surface budget fallacy." Such narratives aren't exactly wrong, but they lead to false reasoning and false conclusions remarkably often.
Because explanations that focus on what happens near the surface (without reference to TOA) are so widespread, we likely need to include them in the article. However, I'd really like to keep the two types of narratives (TOA-focused and surface/lower-atmosphere-focused) separated within the article.
The "reduced heat loss" text is part of the "surface energy budget" narrative, while OLR is a key part of the "TOA energy balance" narrative. Putting them in the same section, as you've done, muddles together those two narratives in a way that I think reduces the clarity of both narratives.
The "reduced heart loss" text may be "simple" content, but it's also primarily associated with the problematic "surface budget" narrative. So, I don't agree that it "belongs higher up in the article."
- - -
You wrote "Why surface and outgoing emissions differ" is really the whole point of the article, so having an individual section titled that doesn't work.
But, that's not "the whole point of the article." Some of the article is about that. Other things the article is about include:
"Why does it matter than surface and outgoing emissions differ?"
The surface energy budget narrative (which doesn't relate to surface vs outgoing emissions)
Random stuff: models, day-night cycle, greenhouse gases, climate change, other planets, etc.
Most of the material in the section you've labeled "Lapse rate" barely mentions the lapse rate, since that's only a fairly minor detail in what they're actually talking about. Rhwentworth (talk) 03:01, 15 July 2023 (UTC)Reply[reply]
Prompting the section with an elementary school level question like "Why do surface and outgoing emissions differ?" is going to invite fifth graders to click in. A jargon filled, difficult to understand section needs a high level title that makes it clear to readers what they're in for. I'm open to other titles, but so long as the section remains full of jargon and difficult to digest, but it needs to relate to the content at the level of the content.
Two of the three sections in that area had "lapse rate" in the title, and all the sections are built on the idea as far as I can tell. That's why you begin the section by defining lapse rate and end with explaining how greenhouse gases and the lapse rate interact. I don't know how you can say that most of the section barely mentions lapse rate.Efbrazil (talk) 20:02, 15 July 2023 (UTC)Reply[reply]
There seems to be a difference of opinion on what to say about greenhouse gases and the absorption of longwave/shortwave radiation. So, let's talk things through here, if there is a remaining disagreement.
My prior version of the text was:
A gas is a greenhouse gas if it absorbs longwave radiation. Greenhouse gases absorb longwave radiation more strongly than they do shortwave radiation.
@Efbrazil asserted "The last sentence is in conflict with sources, which say that the only measure of a greenhouse gas is whether it absorbs longwave radiation or not. I changed the second sentence to be factually correct." and altered the text to:
A gas is a greenhouse gas if it absorbs longwave radiation. Greenhouse gases that absorb more longwave radiation than shortwave radiation cause the greenhouse effect.
However, that change has actually changed things away from being factually correct, and away from alignment with what is said in the cited source. The cited source Wallace (2006) says (p. 121):
water vapor, carbon dioxide, and other gases whose molecules have electric dipole moments absorb radiation more strongly in the longwave part of the spectrum occupied by outgoing terrestrial radiation than the shortwave part occupied by incoming solar radiation.
The phrase "water vapor, carbon dioxide, and other gases whose molecules have electric dipole moments" is describing greenhouse gases, justifying the sentence "Greenhouse gases absorb longwave radiation more strongly than they do shortwave radiation."
However, the edit by u/Efbrazil creates the implication that it is the difference between longwave absorption and shortwave absorption is what creates the greenhouse effect, and that if a gas aborbed both equally, such a gas would not contribute to the greenhouse effect. That implication is factually incorrect (see below*), and is not supported by the source. So, I reverted that change.
There was, however, an additional concern in the change comment, the part saying "the only measure of a greenhouse gas is whether it absorbs longwave radiation or not." My reading of the original text is that it wasn't saying absorbing more longwave than shortwave is a "measure of a greenhouse gas", only that it happens to be true in practice that greenhouse gases absorb longwave more strongly than shortwave. So, I think the original text was correct. But, I concede that it could be misread as suggesting that this is a fundamental characteristic that is a "measure" of whether something is a greenhouse gas. So, my edit also added a prefix "In practice" to try to clarify this. I've reverted/modified the text to be:
A gas is a greenhouse gas if it absorbs longwave radiation. In practice, greenhouse gases absorb longwave radiation more strongly than they do shortwave radiation.
So, that's the current text, which we can discuss if there is a remaining disagreement.
- - -
*The formal definition of the greenhouse effect (longwave surface radiation not reaching space) considers only longwave effects. The definition doesn't care about shortwave absorption properties. A gas could absorb more shortwave than longwave and still contribute to the greenhouse effect.
Of course, given that only longwave radiation matters to the formal definition, one might question the entire final paragraph of the lead-in, which is about longwave vs. shortwave. I pondered for a while whether it makes sense to include such a paragraph. On balance, I think retaining it makes sense. My own analysis tells me that there could be a greenhouse effect even if there was more shortwave absorption than longwave absorption, but not if things get to the point where the atmosphere is 100% opaque to shortwave radiation. So, although the greenhouse effect is formally defined in a way that relates to only longwave radiation, that definition seems to exist within a context where it is understood that there is at least some degree of transparency to shortwave radiation. My read of additional text in Wallace 2006 supports this understanding. So, I think it's reasonable to talk about the atmosphere being largely transparent to shortwave radiation while absorbing longwave, as an aspect of the greenhouse effect, even if it's not part of the formal definition. Rhwentworth (talk) 22:45, 18 July 2023 (UTC)Reply[reply]
Technical subtleties aside, all that I'm really interested in for this part of the lead is to express in some way the differential absorption of short vs long wavelengths. As long as that concept is not glossed over, I'll almost certainly be OK with almost any way of expressing it as long as it's concise. —RCraig09 (talk) 02:19, 19 July 2023 (UTC)Reply[reply]
That sentence is the conclusion to the entire lead, so it needs to be clear and concise. I'm not sure what "in practice" means or whether the sources back it up. It seems to be more something that Rhwentworth thinks is right. My preference would be to simply cut the last sentence at this point since we can't say anything clear about the issue of differential absorption of short vs long wavelengths. Efbrazil (talk) 04:12, 19 July 2023 (UTC)Reply[reply]
The phrase "in practice" is intended to convey that, while greenhouse gases absorb LW radiation more strongly than SW radiation, even though this is not a fact that defines whether something is considered to be a greenhouse gas. It was meant as a solution to your assuming it was meant to be a defining characteristic even though that had not been said. I take it the phrase doesn't help, in that regard, for you.
As to "whether the sources back it up", above I had quoted the exact text from a source that backs that up. What do you find unclear about that quote? (Again, Wallace 2006 says "water vapor, carbon dioxide, and other gases whose molecules have electric dipole moments absorb radiation more strongly in the longwave part of the spectrum occupied by outgoing terrestrial radiation than the shortwave part occupied by incoming solar radiation.")
I'm puzzled as to why you are so unclear about this.
At the same time, I'm not at all attached to including this particular point. I just want the point to be expressed correctly, if it is expressed at all.
I'd also like the whole paragraph in which the statement appears to make sense. If we dropped that last sentence, I'd want to add something so the paragraph doesn't seem incoherent or pointless. One option would be to replace the current last two sentences with something like:
Earth's atmosphere transmits a majority of shortwave radiation (absorbing 23% of sunlight), and absorbs a majority of longwave radiation (absorbing 90% of thermal radiation emitted by the surface).[citation: NASA 2010 Earth's Energy Budget chart]
That might be more interesting and relevant than what we're currently saying in that paragraph about greenhouse gases. Thoughts? Rhwentworth (talk) 11:41, 19 July 2023 (UTC)Reply[reply]
The differential-absorption concept is very important to include, because it is what explains the general description in the first paragraph: "stars emit shortwave radiation that passes through greenhouse gases, but planets emit longwave radiation that is partly absorbed by greenhouse gases". As Rhwentworth remarks, keeping the last sentence, in some form, lets the final paragraph make sense in context. —RCraig09 (talk) 16:00, 19 July 2023 (UTC)Reply[reply]
I much prefer RHwentworth's 2010 energy budget synposis. It is precise and sourced and has actual data. I changed the lead text to a tightened up version of that text. Hopefully happy for all? Efbrazil (talk) 20:26, 21 July 2023 (UTC)Reply[reply]
I'm totally impressed by the pleasant way you've introduced numbers that are understandable to laymen in the context of the final paragraph. I just added a phrase that "closes the loop" and explains how GHE causes GW, a goal that I think is important. I'm not tied to that exact wording, of course. —RCraig09 (talk) 20:35, 21 July 2023 (UTC)Reply[reply]
I amended the phrase "aborbs 90% of outgoing longwave radiation" to "absorbs 90% of the longwave radiation emitted by the surface" since the phrase "outgoing longwave radiation" conventionally mean radiation that reaches space, rendering the prior phrasing at best unclear and at worst incorrect; the revised text is rigorously correct, and I think clearer.
As to the text that "closes the loop", i.e., "thus accumulating energy and warming the Earth's surface"... I'm ambivalent about that clause, which I don't know how to translate to any rigorous underlying math that I know to be true:
Neither the %SW absorbed nor the %surface-LW absorbed are numbers of central importance in the math associated with "accumulating energy." It's not that they don't matter at all, but exactly how much they matter is a bit unclear.
The idea of "energy accumulating" is real only relevant to non-steady-state conditions when the greenhouse effect is increasing. If we're just talking about the baseline steady-state greenhouse effect, then asserting that energy is "accumulating" seems a bit confusing.
I understand the desire to link this paragraph back to the phenomenon of the greenhouse effect making things warmer. I'm a bit uneasy about the text @RCraig09 offered to address that purpose. And... I don't currently have something better to offer, which would both be more correct and meet the goals for simplicity. Rhwentworth (talk) 00:16, 22 July 2023 (UTC)Reply[reply]
I think that currently increasing GHG concentrations imply that the GHE is increasing, so that energy is, in fact, accumulating. When GHG concentrations finally stabilize in a few decades, we can change the text. ;-) —RCraig09 (talk) 03:58, 22 July 2023 (UTC)Reply[reply]
I've been doing a bit of work on the greenhouse gas article lately (even though I have no technical expertise in this field, please excuse me if I get anything wrong). I am trying to reduce excessive overlap between that article and the greenhouse effect article (it's even occurred to me if merging the two articles could be worth debating). At this stage, I would be inclined to move some of the content that is currently in the section called "greenhouse gases" to greenhouse gas; maybe also utilising excerpts. Anyone has any objections or anyone can help with this effort? Please also see on the talk page of the other article: https://en.wikipedia.org/wiki/Talk:Greenhouse_gas#Potential_for_trimming? EMsmile (talk) 19:57, 4 August 2023 (UTC)Reply[reply]
I came here today because I was working on cloud feedback and thought I could transcribe a text block from the section on clouds in this article. I have some doubts though about the quality of content in the clouds section. My doubts stem from the fact that the content is unsourced and that it was added in one go by a student a year ago in this edit. Can someone who knows a bit about clouds please take a look? Also, one has to wonder what content should be at cloud feedback exactly, given that content is located e.g. at climate change feedback, climate sensitivity, greenhouse effect. For now, my idea was to mainly use excerpts. EMsmile (talk) 10:24, 25 September 2023 (UTC)Reply[reply]
I have decided to remove the content in question due to my concerns that I voiced above on 25 Sept. (mainly: unsourced, unnecessary overlap/repetition with other articles). This is the content that I removed:
++++++++
Clouds include liquid clouds, mixed-phase clouds and ice clouds. Liquid clouds are low clouds and have negative radiative forcing. Mixed-phase clouds are clouds coexisted with both liquid water and solid ice at subfreezing temperatures and their radiative properties (optical depth or optical thickness) are substantially influenced by the liquid content. Ice clouds are high clouds and their radiative forcing depends on the ice crystal number concentration, cloud thickness and ice water content.[citation needed]
The radiative properties of liquid clouds depend strongly on cloud microphysical properties, such as cloud liquid water content and cloud drop size distribution. The liquid clouds with higher liquid water content and smaller water droplets will have a stronger negative radiative forcing. The cloud liquid contents are usually related to the surface and atmospheric circulations. Over the warm ocean, the atmosphere is usually rich with water vapor and thus the liquid clouds contain higher liquid water content. When the moist air flows converge in the clouds and generate strong updrafts, the water content can be much higher. Aerosols will influence the cloud drop size distribution. For example, in the polluted industrial regions with lots of aerosols, the water droplets in liquid clouds are often small.[citation needed]
The mixed phase clouds have negative radiative forcing. The radiative forcing of mix-phase clouds has a larger uncertainty than liquid clouds. One reason is that the microphysics are much more complicated because the coexistence of both liquid and solid water. For example, Wegener–Bergeron–Findeisen process can deplete large amounts of water droplets and enlarge small ice crystals to large ones in a short period of time. Hallett-Mossop process[1] will shatter the liquid droplets in the collision with large ice crystals and freeze into a lot of small ice splinters. The cloud radiative properties can change dramatically during these processes because small ice crystals can reflect much more sun lights and generate larger negative radiative forcing, compared with large water droplets.[citation needed]
Cirrus clouds can either enhance or reduce the greenhouse effects, depending on the cloud thickness.[2] Thin cirrus is usually considered to have positive radiative forcing and thick cirrus has negative radiative forcing.[3] Ice water content and ice size distribution also determines cirrus radiative properties. The larger ice water content is, the more cooling effects cirrus have. When cloud ice water contents are the same, cirrus with more smaller ice crystals have larger cooling effects, compared with cirrus with fewer larger ice crystals.[citation needed]EMsmile (talk) 23:08, 18 December 2023 (UTC)Reply[reply]
I've also removed the text block on aerosols that had been added by another student, for the same reason: it overlaps too much with other articles and the content was not up to date. Will use an excerpt instead:
+++++++++
There are two major sources of atmospheric aerosols, natural sources, and anthropogenic sources.[1] Natural sources of aerosols include desert dust, sea salt, volcanic ash, volatile organic compounds (VOC) from vegetation and smoke from forest fires. Aerosols generated from human activities include fossil fuel burning, deforestation fires, and burning of agricultural waste. The amount of anthropogenic aerosols has been dramatically increased since preindustrial times, which is considered as a major contribution to the global air pollution. Since these aerosols have different chemical compositions and physical properties, they can produce different radiative forcing effects, to warm or cool the global climate.
The impact of atmospheric aerosols on climate can be classified as direct or indirect with respect to radiative forcing of the climate system. Aerosols can directly scatter and absorb solar and infrared radiance in the atmosphere, hence it has a direct radiative forcing to the global climate system. Aerosols can also act as cloud condensation nuclei (CCN) to form clouds, resulting in changing the formation and precipitation efficiency of liquid water, ice and mixed phase clouds, thereby causing an indirect radiative forcing associated with these changes in cloud properties.[2][3]
Aerosols that mainly scatter solar radiation can reflect solar radiation back to space, which will cool the global climate. All of the atmospheric aerosols have the capability to scatter incoming solar radiation, but only a few types of aerosols can absorb solar radiation. These include black carbon (BC), organic carbon (OC) and mineral dust, which can induce non-negligible warming effects.[4] The emission of black carbon is significant in developing countries, such as China and India. Black carbon can be transported over long distances, and mixed with other aerosols along the way. Solar-absorption efficiency has a positive correlation with the ratio of black carbon to sulphate.[5]
Particle size and mixing ratio can not only determine the absorption efficiency of BC, but also affect the lifetime of BC. The surface albedo of snow and ice can be reduced due to the deposition of absorbing aerosols, which will also cause heating effects.[6] The heating effects of black carbon at high elevations can be as important as carbon dioxide in the melting of snowpacks and glaciers.[7] In addition to these absorbing aerosols, it is found that the stratospheric aerosols can also induce local warming by increasing longwave radiation reaching the surface and reducing outgoing longwave radiation.[8]EMsmile (talk) 23:42, 18 December 2023 (UTC)Reply[reply]
^Penner, J. E.; Andreae, M. O.; Annegarn, H.; Barrie, L.; Feichter, J.; Hegg, D.; Jayaraman, A.; Leaitch, R.; Murphy, D.; Nganga, J.; Pitari, G. (2001). Aerosols, their Direct and Indirect Effects. Archived from the original on 19 April 2022. Retrieved 21 April 2022.
First image of the lead currently: Greenhouse gases allow sunlight to pass through the atmosphere and heat the planet, but then absorb and redirect some of the longwave radiation (heat) the planet emits.Second image of the lead currently: Energy flows down from the sun and up from the Earth and its atmosphere. When greenhouse gases intercept radiation emitted by Earth's surface, they prevent that radiation from escaping into space, causing surface temperatures to rise by about 33 °C (59 °F).
I think we should generally only have one image for the lead (or an image collage). I don't think this image (see on the right in second position), that is currently in the lead as the second image is suitable at all. I've been looking at it for a while and I simply don't understand it. The images in the lead need to be clear and simple.
As per WP:LEADORDER: " As with all images, but particularly the lead, the image used should be relevant and technically well-produced. It is also common for the lead image to be representative because it provides a visual association for the topic, and allow readers to quickly assess if they have arrived at the right page."
This does not apply to the image on the right. I think it should be moved further down and not be in the lead.
Separately, what is the exact source for the image? It's your own work, User:Efbrazil? If I click on the link provided in Wikimedia Commons I get to this page: https://climatemodels.uchicago.edu/rrtm/ - which looks completely different (and possibly clearer) than your version.
The other image that is currently the first image of the lead looks good at first sight but I wonder if it actually too simplified.
Compare with the image used at greenhouse gas, which could equally well be used at greenhouse effect - but probably has its own flaws as well. (third image on the right) EMsmile (talk) 20:53, 24 January 2024 (UTC)Reply[reply]
The second image was arrived at after extended discussion on a Talk Page (either here or elsewhere, I forget). The first image is a simple conceptual introduction that is a foundation for the second, quantitative image that is well explained by its caption. Since the GHE is a technical subject, we shouldn't concede to a vague perception that only one lead image is needed. The second graphic presents numbers that might be better sourced (in the Commons file description page, or in the caption itself), but that's a ~background issue. —RCraig09 (talk) 21:21, 24 January 2024 (UTC)Reply[reply]
Would “block” work better than “trap” in the first sentence?[edit]
Not wanting to restart a long discussion but I only just saw the discussion above and @Rhwentworths interesting point about some people thinking that something is permanently trapped within the CO2 molecule.
Would “block” work better than “trap” in the first sentence or would that just lead to some other misunderstanding do you think? Chidgk1 (talk) 12:09, 25 April 2023 (UTC)Reply[reply]
Block has it's own problems, like it implies a wall that completely stops progress. Trap is commonly used in government sources and educational materials and is arguably more accurate, as ghg molecules absorb heat radiation. I don't see value in revisiting this. Efbrazil (talk) 16:24, 25 April 2023 (UTC)Reply[reply]
I agree with Efbrazil's comment. —RCraig09 (talk) 16:58, 25 April 2023 (UTC)Reply[reply]
Interesting thought... and, I don't think substituting "block" for "trap" without further word-smithing would improve matters.
I think that, ideally, language would have the following properties:
Clarifies that what is happening is a reduction in heat flow, not something that is all-or-nothing
Doesn't suggest heat being "stuck" anywhere, and especially not in CO2 molecules or air
Doesn't encourage the misunderstanding that time delays are involved
Doesn't encourage the idea that the GHE is mainly about what happens at the surface, rather than being ultimately about energy-balance at the top of the atmosphere
Is accessible due to either widely-used language or being very clear
Doesn't convince people they "understand" when they're actually locking on to a false interpretation
Compatible with what is described in primary sources
Concise and clear
These criteria are in tension with one another. Unfortunately, I don't see a simple solution. It's a tricky issue in general, and the constraints of Wikipedia make it even trickier.
"partially block" is better than "block" because of the all-or-nothing issue.
I'm noticing that "trapping" plays into the idea of "heat" as being a thing that be just be somewhere (which is the popular notion of heat, but NOT the technical notion of heat), while "block" is relevant to the notion of "heat" involving energy in motion (which is the technical notion). But, you can't just say "partially block heat" because most people don't understand that technically, "heat" inherently refers to energy in motion; so, you need to refer to something like blocking "heat flow" or "heat loss."
I imagine there is little enthusiasm for further rewriting. But, just to think it through, how could one in principle tweak "The greenhouse effect occurs when greenhouse gases in a planet's atmosphere trap some of the heat radiated from the planet's surface."? Maybe the final part of the sentence could be something like:
"...partially block the flow of heat radiated from the planet's surface."
"...inhibit the flow..." / "...constrict the flow..." / "...reduce the flow..." / "...impede the flow..."
Unless wording like that stimulates excitement in an editor, this probably won't go anywhere in practice. Rhwentworth (talk) 21:32, 25 April 2023 (UTC)Reply[reply]
I agree that both "block" have "trap" misleading implications, even though they're commonly used in explanations. A more precise description might be something like:
Gaseous carbon compounds (such as CO2) in the atmosphere inhibit excess surface heat from radiating into space. A high level of such compounds can result in a cumulative build-up of heat (from sunlight) primarily in the oceans; this is what is meant by CO2 trapping heat.
I hope this can be clarified further for a non-technical audience. Martin Kealey (talk) 04:00, 8 February 2024 (UTC)Reply[reply]
I think we should phrase proposals as a difference from what's there now. We also need to keep the lead accessible and avoid technical wording there.
While I'm fine with keeping things as they are, I wouldn't be opposed to a change from trap to insulate. For instance, this change would be fine by me:
The greenhouse effect occurs when greenhouse gases in a planet's atmosphere trap some of the heat radiated from the planet's surfaceinsulate the planet's surface from losing heat to space, raising its temperature. This process happens because stars emit shortwave radiation that passes through greenhouse gases, but planets emit longwave radiation that is partly absorbed by greenhouse gases. That difference reduces the rate at which a planet can cool off in response to being warmed by its host star. Adding to greenhouse gases further reduces the rate a planet emits radiation to space, raising its average surface temperature. Efbrazil (talk) 19:00, 8 February 2024 (UTC)Reply[reply]
I think the word "insulate" comes with its own set of problems. I think it's unclear and it makes me think of the insulation layers we put around our houses in the Northern hemisphere to reduce our heating costs. I guess others (perhaps in children's books) have talked about "a blanket" that is wrapped around Earth and causes Earth to heat up. Perhaps a similar concept to "insulate". Not sure. EMsmile (talk) 16:32, 10 February 2024 (UTC)Reply[reply]
Insulation is a material that reduces the pass through of heat or sound or electricity. A gas can be an insulator. A blanket is just a type of insulation. I like the insulate word as it paints a better mental model than the word "trap".
Do you have a different idea for wording? If not, do you prefer the trap wording or the insulate wording? Efbrazil (talk) 20:31, 11 February 2024 (UTC)Reply[reply]
It seems the paragraph "Effect on surface cooling: .... effect of greenhouse gases." needs elaboration[edit]
So that for a layman like me can better understand. Can anybody help? Thanks. ThomasYehYeh (talk) 14:06, 12 February 2024 (UTC)Reply[reply]
That's a pretty vague complaint. Generally if you are confused by something on wikipedia the best thing to do is to follow the references or google the topic, develop an understanding of the issue yourself, then update the wikipedia page to help others with the confusion you were having. Efbrazil (talk) 17:19, 12 February 2024 (UTC)Reply[reply]


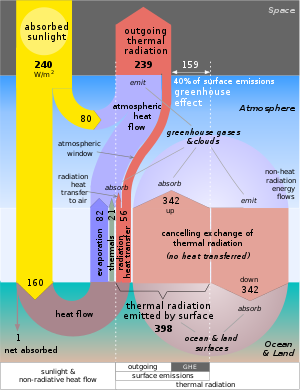


![{\displaystyle T=\left[{\frac {\mathrm {OLR} }{(1-{\tilde {g)))\,\sigma ))\right]^{1/4))](https://wikimedia.org/api/rest_v1/media/math/render/svg/74cf414dabd8122d32e6e5176511df4246d23719)


