Wangqing County
汪清县 · 왕청현 | |
---|---|
Coordinates: 43°19′N 129°46′E / 43.317°N 129.767°E | |
Country | People's Republic of China |
Province | Jilin |
Prefecture | Yanbian |
County seat | Wangqing Town (汪清镇) |
Area | |
• Total | 8,994 km2 (3,473 sq mi) |
Elevation | 236 m (774 ft) |
Population | |
• Total | 260,000 |
• Density | 29/km2 (75/sq mi) |
Time zone | UTC+8 (China Standard) |
Postal code | 133200 |
Wangqing County | |||||||
---|---|---|---|---|---|---|---|
Simplified Chinese | 汪清县 | ||||||
Traditional Chinese | 汪清縣 | ||||||
| |||||||
Chinese Korean name | |||||||
Chosŏn'gŭl | 왕청현 | ||||||
| |||||||
South Korean name | |||||||
Hangul | 왕칭 현 | ||||||
|
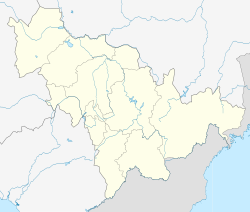
Wangqing County (simplified Chinese: 汪清县; traditional Chinese: 汪清縣; pinyin: Wāngqīng Xiàn; Korean: 왕칭현) is a county of southeastern Jilin province, China. It is under the administration of the Yanbian Korean Autonomous Prefecture. The county's name Wangqing comes from the Manchu language meaning fortress.
Wangqing has eight towns and one township.[1]
Towns:
The only township is Jiguan Township (鸡冠乡 / 계관향)
Climate data for Wangqing (1981−2010 normals) | |||||||||||||
---|---|---|---|---|---|---|---|---|---|---|---|---|---|
Month | Jan | Feb | Mar | Apr | May | Jun | Jul | Aug | Sep | Oct | Nov | Dec | Year |
Record high °C (°F) | 7.2 (45.0) |
12.8 (55.0) |
20.2 (68.4) |
32.2 (90.0) |
33.2 (91.8) |
37.8 (100.0) |
37.3 (99.1) |
35.7 (96.3) |
31.0 (87.8) |
28.0 (82.4) |
21.2 (70.2) |
10.2 (50.4) |
37.8 (100.0) |
Average high °C (°F) | −7.4 (18.7) |
−2.3 (27.9) |
4.6 (40.3) |
14.3 (57.7) |
20.4 (68.7) |
23.8 (74.8) |
25.9 (78.6) |
26.4 (79.5) |
21.6 (70.9) |
14.3 (57.7) |
3.4 (38.1) |
−5.0 (23.0) |
11.7 (53.0) |
Daily mean °C (°F) | −15.5 (4.1) |
−10.2 (13.6) |
−2.4 (27.7) |
6.7 (44.1) |
12.9 (55.2) |
17.3 (63.1) |
20.6 (69.1) |
20.7 (69.3) |
14.2 (57.6) |
6.4 (43.5) |
−3.5 (25.7) |
−12.2 (10.0) |
4.6 (40.3) |
Average low °C (°F) | −22.0 (−7.6) |
−17.2 (1.0) |
−8.8 (16.2) |
−0.2 (31.6) |
6.2 (43.2) |
12.1 (53.8) |
16.5 (61.7) |
16.5 (61.7) |
8.6 (47.5) |
0.0 (32.0) |
−9.1 (15.6) |
−18.0 (−0.4) |
−1.3 (29.7) |
Record low °C (°F) | −36.3 (−33.3) |
−33.1 (−27.6) |
−24.2 (−11.6) |
−11.2 (11.8) |
−3.5 (25.7) |
4.0 (39.2) |
7.9 (46.2) |
3.6 (38.5) |
−4.2 (24.4) |
−13.6 (7.5) |
−27.5 (−17.5) |
−33.5 (−28.3) |
−36.3 (−33.3) |
Average precipitation mm (inches) | 6.9 (0.27) |
6.3 (0.25) |
12.6 (0.50) |
32.8 (1.29) |
58.1 (2.29) |
81.9 (3.22) |
123.9 (4.88) |
109.3 (4.30) |
66.1 (2.60) |
30.0 (1.18) |
13.9 (0.55) |
9.1 (0.36) |
550.9 (21.69) |
Average precipitation days (≥ 0.1 mm) | 3.1 | 3.7 | 5.9 | 8.8 | 13.7 | 14.4 | 13.8 | 14.3 | 9.9 | 7.4 | 6.1 | 4.7 | 105.8 |
Average snowy days | 5.6 | 6.3 | 8.0 | 3.3 | 0.1 | 0 | 0 | 0 | 0 | 1.8 | 6.0 | 7.2 | 38.3 |
Average relative humidity (%) | 65 | 60 | 57 | 55 | 62 | 74 | 81 | 81 | 77 | 65 | 63 | 66 | 67 |
Mean monthly sunshine hours | 180.6 | 197.6 | 227.6 | 215.4 | 220.1 | 195.7 | 181.8 | 188.7 | 202.6 | 199.6 | 159.5 | 158.6 | 2,327.8 |
Percent possible sunshine | 62 | 66 | 61 | 53 | 48 | 43 | 39 | 44 | 55 | 59 | 55 | 57 | 54 |
Source: China Meteorological Administration (precipitation days, snow days, sunshine 1991–2020)[2][3] |