Borough result maps
-
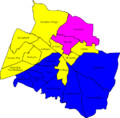 2006 results map
 -
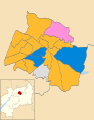
 2008 results map
 -
 2010 results map
 -
 2016 results map
 -
 2018 results map
 -
 2021 results map
 -
 2022 results map
Half of Cheltenham Borough Council is the local authority for Cheltenham in Gloucestershire, England. Half the council is elected every two years, while before 2002 the council was elected by thirds. Since the last boundary changes in 2002, 40 councillors have been elected from 20 wards.[1]


| Party | Candidate | Votes | % | ±% | |
|---|---|---|---|---|---|
| Liberal Democrats | Clive Lloyd | 1,353 | 58.4 | +10.9 | |
| Conservative | Nigel Ball | 658 | 28.4 | -5.7 | |
| Labour | Ian Whyte | 307 | 13.2 | -5.3 | |
| Majority | 695 | 30.0 | |||
| Turnout | 2,318 | 32.13 | |||
| Liberal Democrats hold | Swing | ||||
| Party | Candidate | Votes | % | ±% | |
|---|---|---|---|---|---|
| Conservative | Roy Miles | 895 | 53.5 | -4.4 | |
| Liberal Democrats | Mary Gray | 694 | 41.5 | +11.1 | |
| Labour | Robert Irons | 85 | 5.1 | -6.6 | |
| Majority | 201 | 12.0 | |||
| Turnout | 1,674 | 27.39 | |||
| Conservative hold | Swing | ||||
| Party | Candidate | Votes | % | ±% | |
|---|---|---|---|---|---|
| PAB | Joanna McVeagh | 239 | 39.6 | +0.9 | |
| Liberal Democrats | Charmain Sheppard | 218 | 36.2 | -13.1 | |
| Conservative | Barbara Driver | 146 | 24.2 | +12.2 | |
| Majority | 21 | 3.4 | |||
| Turnout | 603 | 41.7 | |||
| PAB gain from Liberal Democrats | Swing | ||||
| Party | Candidate | Votes | % | ±% | |
|---|---|---|---|---|---|
| PAB | Diane Hibbert | 786 | 59.2 | +0.5 | |
| Conservative | Tess Neale | 344 | 25.9 | +7.5 | |
| Liberal Democrats | Robert Jones | 161 | 12.1 | +4.2 | |
| Labour | Edward Hemmings | 37 | 2.8 | +2.8 | |
| Majority | 625 | 33.3 | |||
| Turnout | 1,328 | 22.0 | |||
| PAB gain from Conservative | Swing | ||||
| Party | Candidate | Votes | % | ±% | |
|---|---|---|---|---|---|
| Conservative | Christine Ryder | 857 | 47.0 | -3.3 | |
| Liberal Democrats | Alan White | 833 | 45.7 | +9.1 | |
| Green | Caroline Griffiths | 84 | 4.6 | -2.2 | |
| Labour | Denis Williams | 49 | 2.7 | -3.6 | |
| Majority | 24 | 1.3 | |||
| Turnout | 1,823 | 42.9 | |||
| Conservative hold | Swing | ||||
| Party | Candidate | Votes | % | ±% | |
|---|---|---|---|---|---|
| Liberal Democrats | Charlie Stewart | 680 | 58.2 | -0.9 | |
| Conservative | Emma Logan | 395 | 33.8 | +0.2 | |
| Green | Cathy Green | 59 | 4.9 | +0.4 | |
| Labour | John Phipps | 37 | 3.2 | +0.3 | |
| Majority | 285 | 24.4 | |||
| Turnout | 1,169 | 27.1 | |||
| Liberal Democrats hold | Swing | ||||
| Party | Candidate | Votes | % | ±% | |
|---|---|---|---|---|---|
| Liberal Democrats | Chris Coleman | 722 | 66.4 | -2.9 | |
| Conservative | Mireille Weller | 188 | 17.3 | -13.4 | |
| Labour | Clive Harriss | 142 | 13.1 | +13.1 | |
| Green | Jon Stubbings | 35 | 3.2 | +3.2 | |
| Majority | 534 | 49.1 | |||
| Turnout | 1,087 | ||||
| Liberal Democrats hold | Swing | ||||
| Party | Candidate | Votes | % | ±% | |
|---|---|---|---|---|---|
| Conservative | Chris Ryder | 852 | 53.7 | -7.1 | |
| Liberal Democrats | Tony Oliver | 735 | 46.3 | +24.9 | |
| Majority | 117 | 7.5 | |||
| Turnout | 1,587 | 37.49 | |||
| Conservative gain from Liberal Democrats | Swing | ||||
| Party | Candidate | Votes | % | ±% | |
|---|---|---|---|---|---|
| Conservative | Louis Savage | 1,477 | 47.1 | +1.1 | |
| Liberal Democrats | Paul McCloskey | 1,037 | 33.0 | -8.9 | |
| Green | Roberta Smart | 243 | 7.7 | N/A | |
| Labour | Helen Pemberton | 200 | 6.4 | N/A | |
| UKIP | Elizabeth Roberts | 181 | 5.8 | -6.3 | |
| Majority | 440 | 14.1 | |||
| Turnout | 3,138 | 74 | |||
| Conservative hold | Swing | ||||
| Party | Candidate | Votes | % | ±% | |
|---|---|---|---|---|---|
| Liberal Democrats | Alex Hegenbarth | 806 | 51.9 | -0.6 | |
| Conservative | Ben Carlton | 512 | 33.0 | +4.4 | |
| Green | Adrian Becker | 130 | 8.4 | +1.1 | |
| Labour | Joanna Hughes | 105 | 6.8 | -4.8 | |
| Majority | 294 | 18.9 | |||
| Turnout | 1,553 | 38 | |||
| Liberal Democrats hold | Swing | ||||
| Party | Candidate | Votes | % | ±% | |
|---|---|---|---|---|---|
| Liberal Democrats | Ed Chidley | 877 | 52.0 | +11.2 | |
| Conservative | Marcia Mary Jacko | 609 | 36.1 | -10.3 | |
| Green | Ian Alexander Cameron | 156 | 9.3 | -3.5 | |
| Labour | Caroline Adele Gavin | 43 | 2.6 | N/A | |
| Majority | 268 | 15.9 | |||
| Turnout | 1,690 | 35 | |||
| Liberal Democrats gain from Conservative | Swing | ||||