Results maps
-
 2015 results map
 -
 2019 results map
 -
 2023 results map
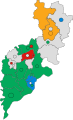
Forest of Dean District Council is the local authority for the Forest of Dean in Gloucestershire, England. The council is elected every four years. Since the last boundary changes in 2019, 38 councillors are elected from 21 wards.[1]


| Party | Candidate | Votes | % | ±% | |
|---|---|---|---|---|---|
| Labour | 185 | 50.8 | |||
| Conservative | 179 | 49.2 | |||
| Majority | 6 | 1.6 | |||
| Turnout | 364 | 35.1 | |||
| Labour hold | Swing | ||||
| Party | Candidate | Votes | % | ±% | |
|---|---|---|---|---|---|
| Labour | 422 | 86.5 | +15.2 | ||
| Conservative | 66 | 13.5 | +13.5 | ||
| Majority | 356 | 73.0 | |||
| Turnout | 488 | 17.0 | |||
| Labour hold | Swing | ||||
| Party | Candidate | Votes | % | ±% | |
|---|---|---|---|---|---|
| Labour | 368 | 46.6 | |||
| Conservative | 201 | 25.4 | |||
| Liberal Democrats | 112 | 14.2 | |||
| Independent | 109 | 13.8 | |||
| Majority | 167 | 21.2 | |||
| Turnout | 790 | 40.7 | |||
| Labour hold | Swing | ||||
| Party | Candidate | Votes | % | ±% | |
|---|---|---|---|---|---|
| Conservative | 267 | 36.6 | -3.4 | ||
| Labour | 242 | 33.2 | -8.5 | ||
| Liberal Democrats | John Holman | 221 | 30.3 | +11.9 | |
| Majority | 25 | 3.4 | |||
| Turnout | 730 | ||||
| Conservative gain from Labour | Swing | ||||
| Party | Candidate | Votes | % | ±% | |
|---|---|---|---|---|---|
| Conservative | James Bevan | 785 | 62.9 | +35.8 | |
| Labour | Albert Stapleton | 366 | 29.3 | -7.6 | |
| Liberal Democrats | Leslie Holman | 98 | 7.8 | +7.8 | |
| Majority | 419 | 33.6 | |||
| Turnout | 1,249 | 32.8 | |||
| Conservative gain from Labour | Swing | ||||
| Party | Candidate | Votes | % | ±% | |
|---|---|---|---|---|---|
| Conservative | Tracey Hunt | 288 | 50.3 | ||
| Independent | Philip Burford | 262 | 45.8 | ||
| Labour | Bruce Hogan | 22 | 3.8 | ||
| Majority | 26 | 4.5 | |||
| Turnout | 572 | ||||
| Conservative hold | Swing | ||||
| Party | Candidate | Votes | % | ±% | |
|---|---|---|---|---|---|
| Labour | Jay Waller | 239 | 52.4 | +7.8 | |
| Conservative | Raymond Puttock | 217 | 47.6 | -7.8 | |
| Majority | 22 | 4.8 | |||
| Turnout | 456 | 32.0 | |||
| Labour gain from Conservative | Swing | ||||
| Party | Candidate | Votes | % | ±% | |
|---|---|---|---|---|---|
| Labour | Bruce Hogan | 286 | 29.0 | +8.0 | |
| Conservative | Brian Robinson | 259 | 26.2 | +2.4 | |
| Liberal Democrats | Andrew Baker | 252 | 25.5 | +4.4 | |
| Independent | Colin Smith | 156 | 15.8 | -18.3 | |
| Independent | Roger Sterry | 34 | 3.4 | +3.4 | |
| Majority | 27 | 2.8 | |||
| Turnout | 987 | 29.0 | |||
| Labour gain from Conservative | Swing | ||||
| Party | Candidate | Votes | % | ±% | |
|---|---|---|---|---|---|
| Conservative | Marrilyn Smart | 365 | 55.2 | +5.0 | |
| Labour | Barten Venner | 156 | 23.6 | -6.0 | |
| Liberal Democrats | David Wheeler | 140 | 21.2 | +1.0 | |
| Majority | 209 | 31.6 | |||
| Turnout | 661 | 51.0 | |||
| Conservative hold | Swing | ||||
| Party | Candidate | Votes | % | ±% | |
|---|---|---|---|---|---|
| Conservative | Len Lawton | 306 | 49.2 | +6.5 | |
| Independent | Edward Wood | 166 | 26.7 | -13.5 | |
| Labour | Cherry Burrow | 96 | 15.4 | -1.7 | |
| Independent | Stephen Tweedie | 54 | 8.7 | +8.7 | |
| Majority | 140 | 22.5 | |||
| Turnout | 622 | 22.0 | |||
| Conservative hold | Swing | ||||
| Party | Candidate | Votes | % | ±% | |
|---|---|---|---|---|---|
| Liberal Democrats | Sue Henchley | 638 | 55.1 | +36.2 | |
| Independent | Tony Pickthall | 239 | 20.6 | -18.2 | |
| Conservative | Brian Jones | 195 | 16.8 | -5.8 | |
| Labour | Helen Stewart | 86 | 7.4 | -12.1 | |
| Majority | 399 | 34.5 | |||
| Turnout | 1,158 | 32.4 | |||
| Liberal Democrats gain from Independent | Swing | ||||
| Party | Candidate | Votes | % | ±% | |
|---|---|---|---|---|---|
| Independent | Mike Meredith-Edwards | 267 | 29.8 | +1.2 | |
| Liberal Democrats | Heather Lusty | 230 | 25.7 | +25.7 | |
| Conservative | David Cooksley | 210 | 23.5 | -17.7 | |
| Labour | Paul Kay | 188 | 21.0 | -9.2 | |
| Majority | 37 | 4.1 | |||
| Turnout | 895 | 21.0 | |||
| Independent gain from Conservative | Swing | ||||
| Party | Candidate | Votes | % | ±% | |
|---|---|---|---|---|---|
| Labour | Roger Sterry | 496 | |||
| Conservative | Aaron Freeman | 236 | |||
| UKIP | Colin Guyton | 119 | |||
| Liberal Democrats | Colin Davies | 89 | |||
| Majority | 260 | ||||
| Turnout | |||||
| Labour hold | Swing | ||||
| Party | Candidate | Votes | % | ±% | |
|---|---|---|---|---|---|
| Labour | Timothy Brian Gwilliam | 276 | 59.7 | +4.6 | |
| Conservative | Nigel John Bluett | 102 | 21.9 | -23.0 | |
| UKIP | John Duncan William McOwan | 85 | 18.4 | +18.4 | |
| Majority | 174 | ||||
| Turnout | |||||
| Labour hold | Swing | ||||
| Party | Candidate | Votes | % | ±% | |
|---|---|---|---|---|---|
| UKIP | Simon Roberts | 308 | 54.3 | +54.3 | |
| Conservative | Mike Rees | 259 | 45.7 | -7.5 | |
| Majority | 49 | 8.6 | |||
| Turnout | 567 | ||||
| UKIP gain from Conservative | Swing | ||||
| Party | Candidate | Votes | % | ±% | |
|---|---|---|---|---|---|
| Labour | Tanya Palmer | 289 | 37.2 | +1.9 | |
| UKIP | Alan Grant | 227 | 29.3 | +29.3 | |
| Conservative | Harry Ives | 104 | 13.4 | -10.3 | |
| Liberal Democrats | Heather Lusty | 80 | 10.3 | -5.6 | |
| Independent | Keith Aburrow | 76 | 9.8 | +9.8 | |
| Majority | 62 | 8.0 | |||
| Turnout | 776 | ||||
| Labour hold | Swing | ||||
| Party | Candidate | Votes | % | ±% | |
|---|---|---|---|---|---|
| Conservative | Clayton Williams | 332 | 65.5 | -14.5 | |
| UKIP | Alex Tritton | 119 | 23.5 | +23.5 | |
| Labour | Andy Hewlett | 56 | 11.0 | -9.0 | |
| Majority | 213 | 42.0 | |||
| Turnout | 507 | ||||
| Conservative hold | Swing | ||||
| Party | Candidate | Votes | % | ±% | |
|---|---|---|---|---|---|
| Independent | Simon Phelps | 321 | 38.5 | +38.5 | |
| Conservative | Richard Boyles | 216 | 25.9 | -4.9 | |
| UKIP | Peter Foster | 102 | 12.2 | +12.2 | |
| Labour | Jenny Shaw | 100 | 12.0 | -1.0 | |
| Green | Sid Phelps | 70 | 8.4 | -7.7 | |
| Liberal Democrats | Ian King | 25 | 3.0 | +3.0 | |
| Majority | 105 | 12.6 | |||
| Turnout | 834 | ||||
| Independent hold | Swing | ||||
| Party | Candidate | Votes | % | ±% | |
|---|---|---|---|---|---|
| Green | Sid Phelps | 360 | 35.3 | +27.9 | |
| Conservative | Kevin White | 248 | 24.3 | +6.2 | |
| Labour | Karen Brown | 231 | 22.7 | -2.0 | |
| UKIP | Roy Bardo | 113 | 11.1 | -12.2 | |
| Liberal Democrats | Heather Lusty | 67 | 6.6 | +6.6 | |
| Majority | 112 | 11.0 | |||
| Turnout | 25.8 | ||||
| Green gain from UKIP | Swing | ||||
| Party | Candidate | Votes | % | ±% | |
|---|---|---|---|---|---|
| Independent | Jamie Elsmore | 561 | 40.7 | +40.7 | |
| Conservative | Terry Hale | 400 | 29.0 | +4.4 | |
| Green | Melanie Getgood | 199 | 14.4 | -5.0 | |
| Labour | Matt Bishop | 185 | 13.4 | +13.4 | |
| Liberal Democrats | John Taylerson | 33 | 2.4 | +2.4 | |
| Majority | 161 | 11.7 | |||
| Turnout | 1,378 | ||||
| Independent hold | Swing | ||||
| Party | Candidate | Votes | % | ±% | |
|---|---|---|---|---|---|
| Labour | Shaun Stammers | 362 | 39.5 | -13.0 | |
| Conservative | Carol Thomas | 319 | 34.8 | +15.1 | |
| Green | Carl Picton | 152 | 16.6 | +16.6 | |
| Independent | Jeremy Charlton-Wright | 83 | 9.1 | -18.7 | |
| Majority | 43 | 4.7 | |||
| Turnout | 916 | ||||
| Labour hold | Swing | ||||