District result maps
-
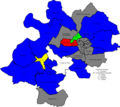 2006 results map
 -
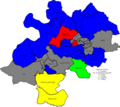
 2007 results map
 -
 2008 results map
 -
 2010 results map
Stroud District Council in Gloucestershire, England is elected every four years. The all-out elections every four years began in 2016; up to and including the 2015 election one third of the council was elected each year, followed by one year without election.


| Party | Candidate | Votes | % | ±% | |
|---|---|---|---|---|---|
| Labour | 308 | 55.2 | |||
| Liberal Democrats | 250 | 44.8 | |||
| Majority | 58 | 10.4 | |||
| Turnout | 558 | ||||
| Labour gain from Liberal Democrats | Swing | ||||
| Party | Candidate | Votes | % | ±% | |
|---|---|---|---|---|---|
| Labour | 857 | 55.8 | |||
| Liberal Democrats | 272 | 17.7 | |||
| Conservative | 240 | 15.6 | |||
| Green | 167 | 10.8 | |||
| Majority | 585 | 381 | |||
| Turnout | 1,536 | ||||
| Labour hold | Swing | ||||
| Party | Candidate | Votes | % | ±% | |
|---|---|---|---|---|---|
| Conservative | 275 | 60.3 | +35.5 | ||
| Liberal Democrats | 159 | 34.9 | -19.7 | ||
| Labour | 22 | 4.8 | -15.8 | ||
| Majority | 116 | 25.4 | |||
| Turnout | 456 | 46.0 | |||
| Conservative gain from Liberal Democrats | Swing | ||||
| Party | Candidate | Votes | % | ±% | |
|---|---|---|---|---|---|
| Liberal Democrats | 1,319 | 35.4 | +9.5 | ||
| Conservative | 1,308 | 35.1 | +4.0 | ||
| Labour | 1,163 | 29.6 | +5.6 | ||
| Majority | 11 | 0.3 | |||
| Turnout | 3,790 | 67.8 | |||
| Liberal Democrats hold | Swing | ||||
| Party | Candidate | Votes | % | ±% | |
|---|---|---|---|---|---|
| Conservative | Tim Frankau | 652 | 39.7 | +3.2 | |
| Liberal Democrats | Brian Marsh | 609 | 37.1 | +8.1 | |
| Labour | Paul Denney | 382 | 23.2 | -11.3 | |
| Majority | 43 | 2.6 | |||
| Turnout | 1,643 | 35.8 | |||
| Conservative hold | Swing | ||||
| Party | Candidate | Votes | % | ±% | |
|---|---|---|---|---|---|
| Labour | Andrew Treacher | 652 | 43.4 | +4.7 | |
| Conservative | Linda Jeffreys | 425 | 28.3 | +0.0 | |
| Liberal Democrats | John Bowen | 257 | 17.1 | -4.1 | |
| Green | Helen Royall | 169 | 11.2 | -0.6 | |
| Majority | 227 | 15.1 | |||
| Turnout | 1,503 | 28.9 | |||
| Labour hold | Swing | ||||
| Party | Candidate | Votes | % | ±% | |
|---|---|---|---|---|---|
| Labour | Thomas Williams | 489 | 43.1 | +6.9 | |
| Conservative | Linda Jeffreys | 407 | 35.9 | +3.1 | |
| Liberal Democrats | Darren Jones | 238 | 21.0 | +8.5 | |
| Majority | 82 | 7.2 | |||
| Turnout | 1,134 | 22.1 | |||
| Labour hold | Swing | ||||
| Party | Candidate | Votes | % | ±% | |
|---|---|---|---|---|---|
| Conservative | Rowland Blackwell | 857 | 44.5 | +6.1 | |
| Green | Chris Harmer | 810 | 42.0 | +4.1 | |
| Labour | Jo Smith | 261 | 13.5 | +0.2 | |
| Majority | 47 | 2.5 | |||
| Turnout | 1,928 | 38.0 | |||
| Conservative hold | Swing | ||||
| Party | Candidate | Votes | % | ±% | |
|---|---|---|---|---|---|
| Conservative | Margaret Wigzell | 366 | 54.9 | +0.5 | |
| Labour | Audrey Smith | 177 | 26.5 | +10.8 | |
| Liberal Democrats | Adrian Walker-Smith | 124 | 18.6 | +6.8 | |
| Majority | 189 | 28.3 | |||
| Turnout | 667 | 38.8 | |||
| Conservative hold | Swing | ||||