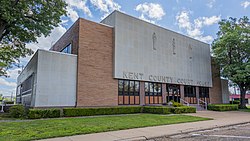
County in Texas, United States
County in Texas
Kent County is a county located in the U.S. state of Texas. As of the 2020 census, its population was 753,[1] making it the sixth-least populous county in Texas. Its county seat is Jayton.[2] The county was created in 1876 and later organized in 1892.[3] It is named for Andrew Kent, who died at the Battle of the Alamo. Kent County is a prohibition or entirely dry county,[4] one of four remaining in the state.[5]
Geography
According to the United States Census Bureau, the county has a total area of 903 square miles (2,340 km2), of which 903 square miles (2,340 km2) are land and 0.4 square miles (1.0 km2) (0.05%) is covered by water.[10]
Major highways
Adjacent counties
Demographics
Note: the US Census treats Hispanic/Latino as an ethnic category. This table excludes Latinos from the racial categories and assigns them to a separate category. Hispanics/Latinos can be of any race.
As of the census[16] of 2000, 859 people, 353 households, and 247 families resided in the county. The population density was less than 1/km2 (2.6/sq mi). The 551 housing units averaged about zero point six units per square mile (0.23 units/km2). The racial makeup of the county was 95.46% White, 0.23% Black or African American, 0.35% Native American, 3.73% from other races, and 0.23% from two or more races. About 9% of the population were Hispanic or Latino of any race.
Of the 353 households, 26.10% had children under the age of 18 living with them, 61.20% were married couples living together, 5.90% had a female householder with no husband present, and 30.00% were not families. About 28% of all households were made up of individuals, and 14.20% had someone living alone who was 65 years of age or older. The average household size was 2.33 and the average family size was 2.83.
In the county, the population was distributed as 20.60% under the age of 18, 5.40% from 18 to 24, 21.80% from 25 to 44, 26.80% from 45 to 64, and 25.50% who were 65 years of age or older. The median age was 47 years. For every 100 females, there were 91.70 males. For every 100 females age 18 and over, there were 91.60 males.
The median income for a household in the county was $30,433, and for a family was $35,568. Males had a median income of $23,875 versus $20,000 for females. The per capita income for the county was $17,626. About 9.20% of families and 10.40% of the population were below the poverty line, including 13.10% of those under age 18 and 6.10% of those age 65 or over.
Politics
Republican Drew Springer, Jr., a businessman from Muenster in Cooke County, has since January 2013 represented Kent County in the Texas House of Representatives.[17]
United States presidential election results for Kent County, Texas[18]
| Year
|
Republican
|
Democratic
|
Third party
|
| No. |
% |
No. |
% |
No. |
%
|
| 2020
|
411
|
88.96%
|
47
|
10.17%
|
4
|
0.87%
|
| 2016
|
360
|
82.95%
|
59
|
13.59%
|
15
|
3.46%
|
| 2012
|
335
|
82.72%
|
66
|
16.30%
|
4
|
0.99%
|
| 2008
|
342
|
76.34%
|
99
|
22.10%
|
7
|
1.56%
|
| 2004
|
382
|
73.18%
|
138
|
26.44%
|
2
|
0.38%
|
| 2000
|
346
|
64.55%
|
185
|
34.51%
|
5
|
0.93%
|
| 1996
|
187
|
36.31%
|
260
|
50.49%
|
68
|
13.20%
|
| 1992
|
175
|
28.69%
|
271
|
44.43%
|
164
|
26.89%
|
| 1988
|
274
|
40.65%
|
398
|
59.05%
|
2
|
0.30%
|
| 1984
|
332
|
56.46%
|
253
|
43.03%
|
3
|
0.51%
|
| 1980
|
339
|
48.85%
|
351
|
50.58%
|
4
|
0.58%
|
| 1976
|
171
|
26.43%
|
474
|
73.26%
|
2
|
0.31%
|
| 1972
|
465
|
67.59%
|
223
|
32.41%
|
0
|
0.00%
|
| 1968
|
143
|
22.56%
|
303
|
47.79%
|
188
|
29.65%
|
| 1964
|
115
|
16.96%
|
563
|
83.04%
|
0
|
0.00%
|
| 1960
|
205
|
29.37%
|
491
|
70.34%
|
2
|
0.29%
|
| 1956
|
234
|
30.99%
|
519
|
68.74%
|
2
|
0.26%
|
| 1952
|
259
|
32.95%
|
526
|
66.92%
|
1
|
0.13%
|
| 1948
|
33
|
6.18%
|
479
|
89.70%
|
22
|
4.12%
|
| 1944
|
31
|
4.71%
|
572
|
86.93%
|
55
|
8.36%
|
| 1940
|
79
|
9.97%
|
712
|
89.90%
|
1
|
0.13%
|
| 1936
|
31
|
5.50%
|
533
|
94.50%
|
0
|
0.00%
|
| 1932
|
23
|
3.92%
|
561
|
95.57%
|
3
|
0.51%
|
| 1928
|
363
|
69.01%
|
163
|
30.99%
|
0
|
0.00%
|
| 1924
|
80
|
16.88%
|
386
|
81.43%
|
8
|
1.69%
|
| 1920
|
45
|
15.90%
|
214
|
75.62%
|
24
|
8.48%
|
| 1916
|
2
|
0.84%
|
212
|
88.70%
|
25
|
10.46%
|
| 1912
|
7
|
3.83%
|
135
|
73.77%
|
41
|
22.40%
|


