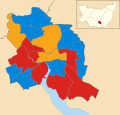
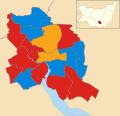
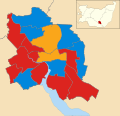
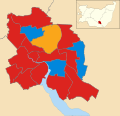
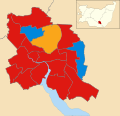
Result maps
-
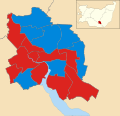
 2002 results map
 -
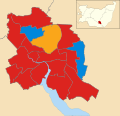
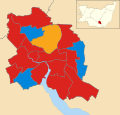
 2003 results map
 -
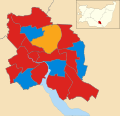
 2004 results map
 -
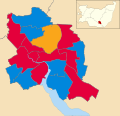
 2006 results map
 -
 2007 results map
 -
 2008 results map
 -
 2010 results map
 -
 2011 results map
 -
 2012 results map
 -
 2014 results map
 -
 2015 results map
 -
 2016 results map
 -
 2018 results map
 -
 2019 results map
 -
 2021 results map
 -
 2022 results map
 -
 2023 results map


