Alleghany County | |
|---|---|
 | |
 Flag  Seal | |
 Location within the U.S. state of North Carolina | |
 North Carolina's location within the U.S. | |
| Coordinates: 36°29′N 81°08′W / 36.49°N 81.13°W | |
| Country | |
| State | |
| Founded | 1859 |
| Named for | Allegheny Mountains |
| Seat | Sparta |
| Largest community | Sparta |
| Area | |
| • Total | 236.26 sq mi (611.9 km2) |
| • Land | 234.84 sq mi (608.2 km2) |
| • Water | 1.42 sq mi (3.7 km2) 0.60% |
| Population (2020) | |
| • Total | 10,888 |
| • Estimate (2023) | 11,342 |
| • Density | 46.36/sq mi (17.90/km2) |
| Time zone | UTC−5 (Eastern) |
| • Summer (DST) | UTC−4 (EDT) |
| Congressional district | 5th |
| Website | www |
Alleghany County (/ˌælɪˈɡeɪni/ AL-ig-AY-nee)[1] is a county located in the U.S. state of North Carolina. As of the 2020 census, the population was 10,888.[2] Its county seat is Sparta.[3]
History
[edit]
The earliest inhabitants of the area eventually comprising Alleghany County were Cherokee and Shawnee Native Americans. By the late 1700s these people had been displaced by English, German, and Scotch-Irish settlers. The county was formed in 1859 from the eastern part of Ashe County.[4] A group of commissioners selected a site near the center of the county to build a courthouse and established the county seat of Sparta.[5] The county was expanded through annexations at the expense of its neighbors from 1869 and 1903.[6] A portion was moved to Wilkes County in 1909.[7]
In 1894, textile executive Hugh Chatham pushed for the founding of a resort in Roaring Gap. It was reorganized in 1925.[8]
The construction of the Blue Ridge Parkway in the 1930s led to increased tourism and growth in Alleghany County.[4] In 1936, the regional Blue Ridge Electric Membership Corporation was founded with the support of the Rural Electrification Act, leading to the eventual expansion of electric utility service in Alleghany.[9] In 1944, the county's first major manufacturer—D&P Pipe Works—opened after relocating from Chicago to Sparta to be closer to supplies of local mountain laurel roots which were used during World War II in the production of wooden tobacco pipes.[10][11] Due to unreliable electricity, the company relied on its own generator for power,[11] but utility service improved after the war.[9]
Alleghany County's economy grew in the 30 years following World War II with the expansion of manufacturing, aided by the improved electricity service and outside companies' desire to locate their facilities in areas with lower land costs, fewer regulations, and less competitive wages.[9] Tourism also grew with the construction of new summer vacation homes.[12] Service-oriented businesses cropped up along U.S. Route 21 to accommodate travelers driving north out of the state. Use of the highway decreased after Interstate 77 was completed in 1975.[9] D&P Pipe Works, later renamed Dr. Grabow, peaked with about 350 employees[11] before health concerns regarding tobacco smoking led to a decline in demand for pipes in the late 20th century.[13] Between 2000 and 2005, the county lost 60 percent of its manufacturing jobs.[14]
Geography
[edit]
According to the U.S. Census Bureau, the county has a total area of 236.26 square miles (611.9 km2), of which 234.84 square miles (608.2 km2) is land and 1.42 square miles (3.7 km2) (0.60%) is water.[15] It is the fifth-smallest county in North Carolina by total area. Alleghany County is located in northwestern North Carolina.[4] It borders the North Carolina counties of Surry, Wilkes, and Ashe, and the Virginia county of Grayson.[16]
The county is located entirely within the Appalachian Mountains region of western North Carolina. Most of the county is located atop a rolling plateau that ranges from 2,500 to 3,000 feet (760 to 910 m) above sea level. The southern border of the county drops abruptly nearly 1,500 feet (460 m) to the Foothills region of North Carolina. The plateau is crossed by numerous hills and mountains. The highest point in the county is Peach Bottom Mountain - Catherine Knob at 4,175 feet (1,273 m) above sea level.[17] The major rivers of Alleghany County are the New River,[18] and the Little River; the latter flows through the town of Sparta, the county seat.
Isolated by mountainous terrain from the remainder of North Carolina to the east, Alleghany County was described in the 19th and early 20th centuries as one of the Lost Provinces of North Carolina.[19]
Due to its elevation, Alleghany County enjoys slightly cooler summers than the lowland areas to the east and south, with temperatures seldom rising over 90 °F (32 °C). In the winter, however, temperatures can frequently be colder than would be expected in a southern state. Daytime highs can fall into the teens or lower, and snowfall can be extremely heavy at times. According to USClimateData.com, the average temperature is 52.85 °F (11.58 °C).
National protected areas
[edit]- Blue Ridge Parkway (part)
- Cumberland Knob Recreation Area (part)
- Doughton Recreation Area (part)
State and local protected areas
[edit]- Bullhead Mountain State Natural Area
- Mitchell River Game Land (part)[20]
- New River State Park (park)
- Raven Knob Scout Reservation (part)
- Stone Mountain State Park (part)
- Thurmond Chatham Game Land (part)[20]
Major water bodies
[edit]- Brush Creek
- Elk Creek
- Laurel Creek
- Lake Louise
- Little River
- New River
- Pine Swamp Creek
- Prather Creek
- Rock Creek
- South Fork New River
Major highways
[edit]Demographics
[edit]| Census | Pop. | Note | %± |
|---|---|---|---|
| 1860 | 3,590 | — | |
| 1870 | 3,691 | 2.8% | |
| 1880 | 5,486 | 48.6% | |
| 1890 | 6,523 | 18.9% | |
| 1900 | 7,759 | 18.9% | |
| 1910 | 7,745 | −0.2% | |
| 1920 | 7,403 | −4.4% | |
| 1930 | 7,186 | −2.9% | |
| 1940 | 8,341 | 16.1% | |
| 1950 | 8,155 | −2.2% | |
| 1960 | 7,734 | −5.2% | |
| 1970 | 8,134 | 5.2% | |
| 1980 | 9,587 | 17.9% | |
| 1990 | 9,590 | 0.0% | |
| 2000 | 10,677 | 11.3% | |
| 2010 | 11,155 | 4.5% | |
| 2020 | 10,888 | −2.4% | |
| 2023 (est.) | 11,342 | [2] | 4.2% |
| U.S. Decennial Census[21] 1790–1960[22] 1900–1990[23] 1990–2000[24] 2010[25] 2020[2] | |||
2020 census
[edit]| Race | Number | Percentage |
|---|---|---|
| White (non-Hispanic) | 9,186 | 84.37% |
| Black or African American (non-Hispanic) | 103 | 0.95% |
| Native American | 35 | 0.32% |
| Asian | 15 | 0.14% |
| Pacific Islander | 6 | 0.06% |
| Other/Mixed | 255 | 2.34% |
| Hispanic or Latino | 1,288 | 11.83% |
As of the 2020 census, there were 10,888 people, 4,920 households, and 3,390 families residing in the county.
2000 census
[edit]At the 2000 census,[27] there were 10,677 people, 4,593 households, and 3,169 families residing in the county. The population density was 46 people per square mile (18 people/km2). There were 6,412 housing units at an average density of 27 units per square mile (10 units/km2). The racial makeup of the county was 95.69% White, 1.23% Black or African American, 0.26% Native American, 0.20% Asian, 0.01% Pacific Islander, 1.75% from other races, and 0.86% from two or more races. 4.96% of the population were Hispanic or Latino of any race.
There were 4,593 households, out of which 24.80% had children under the age of 18 living with them, 58.30% were married couples living together, 7.50% had a female householder with no husband present, and 31.00% were non-families. 27.80% of all households were made up of individuals, and 14.00% had someone living alone who was 65 years of age or older. The average household size was 2.28 and the average family size was 2.75.
In the county, the population was spread out, with 19.40% under the age of 18, 7.40% from 18 to 24, 26.30% from 25 to 44, 27.70% from 45 to 64, and 19.20% who were 65 years of age or older. The median age was 43 years. For every 100 females there were 97.10 males. For every 100 females age 18 and over, there were 95.50 males.
The median income for a household in the county was $29,244, and the median income for a family was $38,473. Males had a median income of $25,462 versus $18,851 for females. The per capita income for the county was $17,691. About 11.30% of families and 17.20% of the population were below the poverty line, including 20.80% of those under age 18 and 25.00% of those age 65 or over.
Law and government
[edit]Government
[edit]Alleghany County is led by a five-member board of commissioners elected county-wide in partisan contests to serve staggered four-year terms. The commissioners elect their own chairman, who serves a one-year term. The commission is responsible for overseeing county government, passing ordinances, levying taxes, and creating the county budget. It also appoints the county attorney and the county manager.[28] The county manager serves as the head administrator of the county government.[29]
The county is a member of the regional High Country Council of Governments.[30] The county also has its own Soil and Water Conservation District led by two appointed and three elected board members.[31] It is located entirely in the North Carolina Senate's 47th district, the North Carolina House of Representatives' 93rd district,[32] and North Carolina's 5th congressional district.[33]
Judicial system
[edit]Alleghany County lies within the bounds of North Carolina's 34th Prosecutorial District, the 23rd Superior Court District, and the 23rd District Court District.[34]
Politics
[edit]| Historical presidential election returns | |||||||||||||||||||||||||||||||||||||||||||||||||||||||||||||||||||||||||||||||||||||||||||||||||||||||||||||||||||||||||||||||||||||||||||||||||||||||||||||||||||||||||||||||||||||||||||||||||||||||||||||||||
| |||||||||||||||||||||||||||||||||||||||||||||||||||||||||||||||||||||||||||||||||||||||||||||||||||||||||||||||||||||||||||||||||||||||||||||||||||||||||||||||||||||||||||||||||||||||||||||||||||||||||||||||||
In the first decades of the 21st century, elections in Alleghany County trended increasingly Republican.[36] In the 2022 elections, Republicans won all but one county-wide office.[37]
Economy
[edit]
Alleghany County is one of several North Carolina counties which produces a significant amount of Christmas trees, with an estimated 1.2 million such trees from the county being sold in 2022.[38] Alleghany also produces the most pumpkins among the counties in the state.[39] For 2023, the North Carolina Department of Commerce rated Alleghany as a Tier 2 county, between the state's most prosperous and economically distressed.[40]
Education
[edit]Wilkes Community College maintains an academic center in Sparta.[41] According to the 2021 American Community Survey, an estimated 20.4 percent of county residents have attained a bachelor's degree or higher level of education.[16]
Healthcare
[edit]Alleghany County is served by a single hospital, Alleghany Memorial Hospital, based in Sparta.[42]
Culture
[edit]
An arts community is centered in Sparta. The town hosts a "Music on Main" series of weekly public concerts for local musicians from June through September every year.[18]
Communities
[edit]
Town
[edit]- Sparta (county seat and largest community)
Townships
[edit]Alleghany County townships are:[43]
Unincorporated communities
[edit]- Amelia
- Barrett
- Cherry Lane
- Edwards Crossroads
- Ennice
- Glade Valley
- Hare
- Laurel Springs
- Piney Creek
- Roaring Gap
- Scottville (partly in Ashe County)
- Stratford
- Twin Oaks
- Whitehead
Notable people
[edit]- Robert L. Doughton (1863–1954), United States Congressman from Alleghany County from 1911 to 1953. From 1933 to 1947 he was the Chairman of the House Ways and Means Committee. He used his influence as chairman to create the Blue Ridge Parkway, which runs along the county's eastern and southern borders. Doughton Park, the largest and most popular park on the Parkway, is named in his honor. He also played a major role in the passage of the Social Security Act.
- Rufus A. Doughton (1857–1946), older brother of Robert Doughton. He served as the Speaker of the North Carolina House of Representatives, and was Lieutenant Governor of North Carolina from 1893 to 1897.
- Bertie Dickens (1902–1994), old-time banjo player who lived most of her life in Ennice, North Carolina. She received the North Carolina Heritage Award in 1992.
- Zach Galifianakis (born 1969), stand-up comedian and actor, lives on a farm near Sparta and splits his time between the farm and his work in New York City.
- Del Reeves (1932–2007), country music entertainer on the United Artists record label. He became a member of the Grand Ole Opry in 1966 and his record "Girl on the Billboard" sold over a million copies.
See also
[edit]- List of counties in North Carolina
- National Register of Historic Places listings in Alleghany County, North Carolina
- List of Highway Historical Markers in Alleghany County, North Carolina
References
[edit]- ^ Talk Like A Tarheel Archived June 22, 2013, at the Wayback Machine, from the North Carolina Collection website at the University of North Carolina at Chapel Hill. Retrieved January 29, 2013.
- ^ a b c "QuickFacts: Alleghany County, North Carolina". United States Census Bureau. Retrieved March 21, 2024.
- ^ "Find a County". National Association of Counties. Archived from the original on May 31, 2011. Retrieved June 7, 2011.
- ^ a b c Rider, Bernadette (2006). "Alleghany County". NCPedia. North Carolina Government & Heritage Library. Retrieved April 28, 2023.
- ^ Corbitt 2000, pp. 3–4.
- ^ Corbitt 2000, pp. 4–7.
- ^ Corbitt 2000, p. 7.
- ^ Trudge, Old (July 7, 1967). "A New Frontier for the Traveler". The State. pp. 9–10.
- ^ a b c d Bamberg, Bob (December 15, 2021). "When electricity came to Alleghany". The Alleghany News. p. 6A.
- ^ Henion, Leigh Ann (October 25, 2019). "The Pipes of Sparta: Dr. Grabow". Our State. Retrieved April 30, 2023.
- ^ a b c Bamberg, Bob (August 7, 2019). "After 75 years, smoking pipes are still made in Sparta". The Alleghany News. Vol. 129, no. 52. pp. 1A, 3A. Retrieved April 30, 2023.
- ^ Davis, Chester (August 14, 1966). "Boom Comes To Alleghany". Winston-Salem Journal and Sentinel. p. C1.
- ^ Bamberg, Bob (December 5, 2018). "A brief history of local pipe manufacturing". The Alleghany News. Vol. 129, no. 17. p. 2A.
- ^ "Development booms in mountains". The News & Observer. Associated Press. December 12, 2006. p. 5B.
- ^ "2020 County Gazetteer Files – North Carolina". United States Census Bureau. August 23, 2022. Retrieved September 9, 2023.
- ^ a b "Alleghany County, North Carolina". U.S. Census Bureau. Retrieved May 3, 2023.
- ^ "NC DEQ: NC Geological Survey". www.geology.enr.state.nc.us. Retrieved March 14, 2018.
- ^ a b Reardon, Melissa (July 2019). "Sparta: Detour off the Blue Ridge Parkway this summer to take in arts, outdoors, and small-town allure". WNC Magazine. Retrieved May 2, 2023.
- ^ Tabler, Dave (August 30, 2016). "The Lost Provinces". Appalachian History. Archived from the original on February 5, 2018. Retrieved February 4, 2018.
- ^ a b "NCWRC Game Lands". www.ncpaws.org. Retrieved March 30, 2023.
- ^ "U.S. Decennial Census". United States Census Bureau. Retrieved January 11, 2015.
- ^ "Historical Census Browser". University of Virginia Library. Retrieved January 11, 2015.
- ^ Forstall, Richard L., ed. (March 27, 1995). "Population of Counties by Decennial Census: 1900 to 1990". United States Census Bureau. Retrieved January 11, 2015.
- ^ "Census 2000 PHC-T-4. Ranking Tables for Counties: 1990 and 2000" (PDF). United States Census Bureau. April 2, 2001. Archived (PDF) from the original on March 27, 2010. Retrieved January 11, 2015.
- ^ "State & County QuickFacts". United States Census Bureau. Archived from the original on May 12, 2001. Retrieved October 17, 2013.
- ^ "Explore Census Data". data.census.gov. Retrieved December 20, 2021.
- ^ "U.S. Census website". United States Census Bureau. Retrieved January 31, 2008.
- ^ "Board of Commissioners". Alamance County Government. Retrieved April 28, 2023.
- ^ "Administration". Alamance County Government. Retrieved April 28, 2023.
- ^ "Alleghany County". High Country Council of Governments. April 28, 2023. Retrieved April 28, 2023.
- ^ "Four seek seats on Soil and Water Board". The Alleghany News. Vol. 133, no. 49. July 13, 2022. pp. 1A–2A. Retrieved April 28, 2023.
- ^ "Rockingham County Representation : 2023-2024 Session". North Carolina General Assembly. Retrieved May 1, 2023.
- ^ Battaglia, Dannielle (February 27, 2022). "New NC Voting Maps: Where do you fall?". The News & Observer. p. 20A.
- ^ "Alleghany County". North Carolina Judicial Branch. Retrieved May 2, 2023.
- ^ Leip, David. "Dave Leip's Atlas of U.S. Presidential Elections". uselectionatlas.org. Retrieved March 14, 2018.
- ^ Fouriezos, Nick (November 4, 2022). "These North Carolina counties were politically aligned. Education has divided them". USA Today. Retrieved October 24, 2023.
- ^ "Republicans sweep local election results". The Alleghany News. Vol. 134, no. 13. November 9, 2022. p. 1A. Retrieved April 28, 2023.
- ^ Lyall, Carlean (January 25, 2023). "Why has choose and cut declined?". The Alleghany News. Vol. 134, no. 24. pp. 1A, 6A. Retrieved April 28, 2023.
- ^ O'Connor, Kristi (October 16, 2020). "Pumpkin farming in the Blue Ridge Mountains booming". WBTV News. Gray Media. Retrieved May 3, 2023.
- ^ Craver, Richard (November 30, 2022). "Forsyth County ranked in the middle for economic health in NC". Winston-Salem Journal. Retrieved October 24, 2023.
- ^ "Locations : Alleghany Center". Wilkes Community College. Retrieved May 2, 2023.
- ^ Weeks, Olivia (February 24, 2023). "Q&A: Providing Healthcare in Rural Communities is a Challenge and a 'Labor of Love'". The Daily Yonder. Retrieved May 1, 2023.
- ^ Powell 1976, p. 7.
Works cited
[edit]- Corbitt, David Leroy (2000). The formation of the North Carolina counties, 1663-1943 (reprint ed.). Raleigh: North Carolina Division of Archives and History. OCLC 46398241.
- Powell, William S. (1976). The North Carolina Gazetteer: A Dictionary of Tar Heel Places. Chapel Hill: The University of North Carolina Press. ISBN 9780807812471.
External links
[edit] Geographic data related to Alleghany County, North Carolina at OpenStreetMap
- Official website
- Alleghany News
Places adjacent to Alleghany County, North Carolina | ||||||||||||||||
|---|---|---|---|---|---|---|---|---|---|---|---|---|---|---|---|---|
| ||||||||||||||||
Municipalities and communities of Alleghany County, North Carolina, United States | ||
|---|---|---|
| Town | 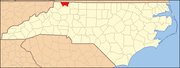 | |
| Townships | ||
| Unincorporated communities | ||
| International | |
|---|---|
| National | |
| Geographic | |
| Other | |