Continuous probability distribution
Weibull (2-parameter)|
Probability density function 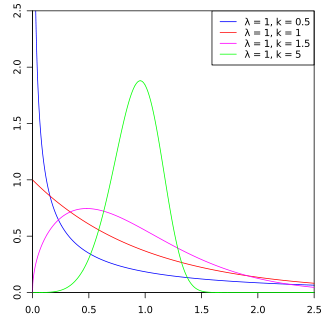 |
|
Cumulative distribution function  |
| Parameters |
 scale scale
 shape shape |
|---|
| Support |
 |
|---|
| PDF |
 |
|---|
| CDF |
 |
|---|
| Quantile |
 |
|---|
| Mean |
 |
|---|
| Median |
 |
|---|
| Mode |
 |
|---|
| Variance |
![{\displaystyle \lambda ^{2}\left[\Gamma \left(1+{\frac {2}{k))\right)-\left(\Gamma \left(1+{\frac {1}{k))\right)\right)^{2}\right]\,}](https://wikimedia.org/api/rest_v1/media/math/render/svg/55fa6b5cdbe81bb9e6aa0452a2c619623cb23f14) |
|---|
| Skewness |
 |
|---|
| Excess kurtosis |
(see text) |
|---|
| Entropy |
 |
|---|
| MGF |
 |
|---|
| CF |
 |
|---|
| Kullback–Leibler divergence |
see below |
|---|
In probability theory and statistics, the Weibull distribution is a continuous probability distribution. It models a broad range of random variables, largely in the nature of a time to failure or time between events. Examples are maximum one-day rainfalls and the time a user spends on a web page.
The distribution is named after Swedish mathematician Waloddi Weibull, who described it in detail in 1939,[1] although it was first identified by René Maurice Fréchet and first applied by Rosin & Rammler (1933) to describe a particle size distribution.
Definition
Standard parameterization
The probability density function of a Weibull random variable is[2][3]

where k > 0 is the shape parameter and λ > 0 is the scale parameter of the distribution. Its complementary cumulative distribution function is a stretched exponential function. The Weibull distribution is related to a number of other probability distributions; in particular, it interpolates between the exponential distribution (k = 1) and the Rayleigh distribution (k = 2 and  [4]).
[4]).
If the quantity X is a "time-to-failure", the Weibull distribution gives a distribution for which the failure rate is proportional to a power of time. The shape parameter, k, is that power plus one, and so this parameter can be interpreted directly as follows:[5]
- A value of
 indicates that the failure rate decreases over time (like in case of the Lindy effect, which however corresponds to Pareto distributions[6] rather than Weibull distributions). This happens if there is significant "infant mortality", or defective items failing early and the failure rate decreasing over time as the defective items are weeded out of the population. In the context of the diffusion of innovations, this means negative word of mouth: the hazard function is a monotonically decreasing function of the proportion of adopters;
- A value of
 indicates that the failure rate is constant over time. This might suggest random external events are causing mortality, or failure. The Weibull distribution reduces to an exponential distribution;
- A value of
 indicates that the failure rate increases with time. This happens if there is an "aging" process, or parts that are more likely to fail as time goes on. In the context of the diffusion of innovations, this means positive word of mouth: the hazard function is a monotonically increasing function of the proportion of adopters. The function is first convex, then concave with an inflection point at
  .
.
In the field of materials science, the shape parameter k of a distribution of strengths is known as the Weibull modulus. In the context of diffusion of innovations, the Weibull distribution is a "pure" imitation/rejection model.
Alternative parameterizations
First alternative
Applications in medical statistics and econometrics often adopt a different parameterization.[7][8] The shape parameter k is the same as above, while the scale parameter is  . In this case, for x ≥ 0, the probability density function is

the cumulative distribution function is

the quantile function is

the hazard function is

and the mean is

Second alternative
A second alternative parameterization can also be found.[9][10] The shape parameter k is the same as in the standard case, while the scale parameter λ is replaced with a rate parameter β = 1/λ. Then, for x ≥ 0, the probability density function is

the cumulative distribution function is

the quantile function is

and the hazard function is

In all three parameterizations, the hazard is decreasing for k < 1, increasing for k > 1 and constant for k = 1, in which case the Weibull distribution reduces to an exponential distribution.
Properties
Density function
The form of the density function of the Weibull distribution changes drastically with the value of k. For 0 < k < 1, the density function tends to ∞ as x approaches zero from above and is strictly decreasing. For k = 1, the density function tends to 1/λ as x approaches zero from above and is strictly decreasing. For k > 1, the density function tends to zero as x approaches zero from above, increases until its mode and decreases after it. The density function has infinite negative slope at x = 0 if 0 < k < 1, infinite positive slope at x = 0 if 1 < k < 2 and null slope at x = 0 if k > 2. For k = 1 the density has a finite negative slope at x = 0. For k = 2 the density has a finite positive slope at x = 0. As k goes to infinity, the Weibull distribution converges to a Dirac delta distribution centered at x = λ. Moreover, the skewness and coefficient of variation depend only on the shape parameter. A generalization of the Weibull distribution is the hyperbolastic distribution of type III.
Cumulative distribution function
The cumulative distribution function for the Weibull distribution is

for x ≥ 0, and F(x; k; λ) = 0 for x < 0.
If x = λ then F(x; k; λ) = 1 − e−1 ≈ 0.632 for all values of k. Vice versa: at F(x; k; λ) = 0.632 the value of x ≈ λ.
The quantile (inverse cumulative distribution) function for the Weibull distribution is

for 0 ≤ p < 1.
The failure rate h (or hazard function) is given by

The Mean time between failures MTBF is

Moments
The moment generating function of the logarithm of a Weibull distributed random variable is given by[11]
![{\displaystyle \operatorname {E} \left[e^{t\log X}\right]=\lambda ^{t}\Gamma \left({\frac {t}{k))+1\right)}](https://wikimedia.org/api/rest_v1/media/math/render/svg/992fe36496b44da30c136e71b8d389bbd3cf5c28)
where Γ is the gamma function. Similarly, the characteristic function of log X is given by
![{\displaystyle \operatorname {E} \left[e^{it\log X}\right]=\lambda ^{it}\Gamma \left({\frac {it}{k))+1\right).}](https://wikimedia.org/api/rest_v1/media/math/render/svg/cafc0ab087d13e9a81eefaa6164a1165323b3065)
In particular, the nth raw moment of X is given by

The mean and variance of a Weibull random variable can be expressed as

and
![{\displaystyle \operatorname {var} (X)=\lambda ^{2}\left[\Gamma \left(1+{\frac {2}{k))\right)-\left(\Gamma \left(1+{\frac {1}{k))\right)\right)^{2}\right]\,.}](https://wikimedia.org/api/rest_v1/media/math/render/svg/c1fbeabd8489533ec121cdd57f2003ba5229d5d8)
The skewness is given by
![{\displaystyle \gamma _{1}={\frac {2\Gamma _{1}^{3}-3\Gamma _{1}\Gamma _{2}+\Gamma _{3)){[\Gamma _{2}-\Gamma _{1}^{2}]^{3/2))))](https://wikimedia.org/api/rest_v1/media/math/render/svg/4debe36ebd435e3ab5ec52a91d071e8b89fd75be)
where  , which may also be written as

where the mean is denoted by μ and the standard deviation is denoted by σ.
The excess kurtosis is given by
![{\displaystyle \gamma _{2}={\frac {-6\Gamma _{1}^{4}+12\Gamma _{1}^{2}\Gamma _{2}-3\Gamma _{2}^{2}-4\Gamma _{1}\Gamma _{3}+\Gamma _{4)){[\Gamma _{2}-\Gamma _{1}^{2}]^{2))))](https://wikimedia.org/api/rest_v1/media/math/render/svg/22013ea4a622ab7a9f7764bc198cfb7ee020c5dd)
where . The kurtosis excess may also be written as:

Moment generating function
A variety of expressions are available for the moment generating function of X itself. As a power series, since the raw moments are already known, one has
![{\displaystyle \operatorname {E} \left[e^{tX}\right]=\sum _{n=0}^{\infty }{\frac {t^{n}\lambda ^{n)){n!))\Gamma \left(1+{\frac {n}{k))\right).}](https://wikimedia.org/api/rest_v1/media/math/render/svg/fb62dff92f0aad620ce5249b5c4463525c568bea)
Alternatively, one can attempt to deal directly with the integral
![{\displaystyle \operatorname {E} \left[e^{tX}\right]=\int _{0}^{\infty }e^{tx}{\frac {k}{\lambda ))\left({\frac {x}{\lambda ))\right)^{k-1}e^{-(x/\lambda )^{k))\,dx.}](https://wikimedia.org/api/rest_v1/media/math/render/svg/60d34e366e5a1f3e487afba88552504547a972f9)
If the parameter k is assumed to be a rational number, expressed as k = p/q where p and q are integers, then this integral can be evaluated analytically.[12] With t replaced by −t, one finds
![{\displaystyle \operatorname {E} \left[e^{-tX}\right]={\frac {1}{\lambda ^{k}\,t^{k))}\,{\frac {p^{k}\,{\sqrt {q/p))}{({\sqrt {2\pi )))^{q+p-2))}\,G_{p,q}^{\,q,p}\!\left(\left.{\begin{matrix}{\frac {1-k}{p)),{\frac {2-k}{p)),\dots ,{\frac {p-k}{p))\\{\frac {0}{q)),{\frac {1}{q)),\dots ,{\frac {q-1}{q))\end{matrix))\;\right|\,{\frac {p^{p)){\left(q\,\lambda ^{k}\,t^{k}\right)^{q))}\right)}](https://wikimedia.org/api/rest_v1/media/math/render/svg/992350d0b4b2c014907ad897f1764513c53539ec)
where G is the Meijer G-function.
The characteristic function has also been obtained by Muraleedharan et al. (2007). The characteristic function and moment generating function of 3-parameter Weibull distribution have also been derived by Muraleedharan & Soares (2014) harvtxt error: no target: CITEREFMuraleedharanSoares2014 (help) by a direct approach.
Minima
Let  be independent and identically distributed Weibull random variables with scale parameter
  and shape parameter
  . If the minimum of these
  random variables is
  , then the cumulative probability distribution of
  given by

That is, will also be Weibull distributed with scale parameter  and with shape parameter .
Reparametrization tricks
Fix some  . Let
. Let  be nonnegative, and not all zero, and let
  be independent samples of
  , then[13]

 .
.
Shannon entropy
The information entropy is given by

where  is the Euler–Mascheroni constant. The Weibull distribution is the maximum entropy distribution for a non-negative real random variate with a fixed expected value of xk equal to λk and a fixed expected value of ln(xk) equal to ln(λk) − .
Kullback–Leibler divergence
The Kullback–Leibler divergence between two Weibulll distributions is given by[14]
![{\displaystyle D_{\text{KL))(\mathrm {Weib} _{1}\parallel \mathrm {Weib} _{2})=\log {\frac {k_{1)){\lambda _{1}^{k_{1))))-\log {\frac {k_{2)){\lambda _{2}^{k_{2))))+(k_{1}-k_{2})\left[\log \lambda _{1}-{\frac {\gamma }{k_{1))}\right]+\left({\frac {\lambda _{1)){\lambda _{2))}\right)^{k_{2))\Gamma \left({\frac {k_{2)){k_{1))}+1\right)-1}](https://wikimedia.org/api/rest_v1/media/math/render/svg/6b8b701f13ae0a9c80fb4358f74495e09b96fe3f)


![{\displaystyle {\begin{aligned}F(x)&=1-e^{-(x/\lambda )^{k))\\[4pt]-\ln(1-F(x))&=(x/\lambda )^{k}\\[4pt]\underbrace {\ln(-\ln(1-F(x)))} _{\textrm {'y'))&=\underbrace {k\ln x} _{\textrm {'mx'))-\underbrace {k\ln \lambda } _{\textrm {'c'))\end{aligned))}](https://wikimedia.org/api/rest_v1/media/math/render/svg/211d2c05e68101789978ade36bb598b66e56c5a0)


