Result maps
-
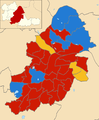
 2022
2022 -
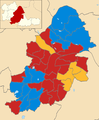
 2018
2018 -
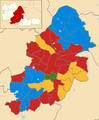
 2016
2016 -
 2015
2015 -
 2014
2014 -
 2012
2012 -
 2011
2011 -
 2010
2010 -
 2008
2008
Birmingham City Council elections are held every four years. Birmingham City Council is the local authority for the metropolitan district of Birmingham in the West Midlands, England. Since the last boundary changes in 2018, 101 councillors have been elected from 69 wards.[1] Prior to 2018 elections were held three years out of every four, with a third of the council elected each time.[2]
From 1889 to 1974 Birmingham was a county borough, independent of any county council.[3] Under the Local Government Act 1972 it had its territory enlarged and became a metropolitan borough, with West Midlands County Council providing county-level services. The first election to the reconstituted city council was held in 1973, initially operating as a shadow authority before coming into its revised powers on 1 April 1974. West Midlands County Council was abolished in 1986 and Birmingham became a unitary authority. Political control of the council since 1974 has been held by the following parties:[4][5]
| Party in control | Years | |
|---|---|---|
| Labour | 1974–1975 | |
| No overall control | 1975–1976 | |
| Conservative | 1976–1979 | |
| No overall control | 1979–1980 | |
| Labour | 1980–1982 | |
| Conservative | 1982–1984 | |
| Labour | 1984–2003 | |
| No overall control | 2003–2012 | |
| Labour | 2012–present | |
|
See also: List of mayors of Birmingham |
The role of Lord Mayor of Birmingham is largely ceremonial, with political leadership provided by the leader of the council. The first leader of the council after the 1974 reforms, Clive Wilkinson, had been the leader of the old county borough of Birmingham since December 1973.[6] The leaders since 1974 have been:
| Councillor | Party | From | To | |
|---|---|---|---|---|
| Clive Wilkinson[6] | Labour | 1 Apr 1974 | May 1976 | |
| Neville Bosworth[7] | Conservative | May 1976 | May 1980 | |
| Clive Wilkinson[8] | Labour | May 1980 | May 1982 | |
| Neville Bosworth[9] | Conservative | May 1982 | May 1984 | |
| Dick Knowles[10] | Labour | May 1984 | Oct 1993 | |
| Theresa Stewart[11] | Labour | Oct 1993 | May 1999 | |
| Albert Bore[12] | Labour | May 1999 | May 2004 | |
| Mike Whitby | Conservative | June 2004 | 3 May 2012 | |
| Albert Bore | Labour | 3 May 2012 | 1 Dec 2015 | |
| John Clancy[13][14] | Labour | 1 Dec 2015 | 11 Sep 2017 | |
| Ian Ward[15] | Labour | 7 Nov 2017 | 23 May 2023 | |
| John Cotton[16] | Labour | 23 May 2023 | ||


Death of Labour Cllr Mohammed Azim.[19]
| Party | Candidate | Votes | % | ±% | |
|---|---|---|---|---|---|
| Labour | Saima Ahmed | 2,410 | 69.6 | ||
| Liberal Democrats | Shaukat Khan | 517 | 14.9 | ||
| Conservative | Zhor Malik | 305 | 8.8 | ||
| Workers Party | Phil Bevin | 158 | 4.6 | ||
| Green | Michael Harrison | 72 | 2.1 | ||
| Majority | 1,893 | 54.7 | |||
| Turnout | 3,462 | ||||
| Labour hold | Swing | ||||
Death of Liberal Democrats Cllr Neil Eustace.[21]
| Party | Candidate | Votes | % | ±% | |
|---|---|---|---|---|---|
| Liberal Democrats | Deborah Harries | 1,312 | 65.3 | ||
| Labour | Carmel Corrigan | 609 | 30.3 | ||
| Conservative | Pervez Akhtar | 89 | 4.4 | ||
| Majority | 703 | 35.0 | |||
| Turnout | 2,010 | ||||
| Liberal Democrats hold | Swing | ||||
Resignation of Labour Cllr Lucy Seymour-Smith.[23]
| Party | Candidate | Votes | % | ±% | |
|---|---|---|---|---|---|
| Labour | Katherine Carlisle | 2,553 | 54.0 | ||
| Conservative | Clair Felton | 1,534 | 32.5 | ||
| Green | Joseph Peacock | 252 | 5.3 | ||
| Independent | Nadia Rashid | 107 | 2.3 | ||
| Liberal Democrats | Ian Neal | 91 | 1.9 | ||
| Independent | James Dalton | 64 | 1.4 | ||
| Freedom Alliance | John Goss | 49 | 1.0 | ||
| Reform UK | Ian Bishop | 42 | 0.9 | ||
| TUSC | Abdul Haq | 34 | 0.7 | ||
| Majority | 1,019 | 21.3 | |||
| Turnout | 4,781 | ||||
| Rejected ballots | 55 | ||||
| Labour hold | Swing | ||||
Resignation of Labour Cllr Lou Robson.[25]
| Party | Candidate | Votes | % | ±% | |
|---|---|---|---|---|---|
| Labour | Saima Suleman | 2,542 | 53.7 | ||
| Independent | Bob Harvey | 833 | 17.6 | ||
| Conservative | Pranav Gupta | 819 | 17.3 | ||
| Green | Chris Garghan | 246 | 5.2 | ||
| Liberal Democrats | Andy Spruce | 242 | 5.1 | ||
| TUSC | Eamonn Flynn | 55 | 1.2 | ||
| Majority | 1,709 | 36.1 | |||
| Turnout | 4,737 | ||||
| Labour hold | Swing | ||||
Death of Labour Cllr Keith Linnecor.[27]
| Party | Candidate | Votes | % | ±% | |
|---|---|---|---|---|---|
| Conservative | Darius Sandhu | 1,981 | 54.4 | ||
| Labour | Uzma Ahmed | 1,086 | 29.8 | ||
| Liberal Democrats | Joshua Bunting | 238 | 6.5 | ||
| Green | Benjamin Craddock | 165 | 4.5 | ||
| Independent | Graham Green | 112 | 3.1 | ||
| TUSC | Ted Woodley | 58 | 1.6 | ||
| Majority | 895 | 24.6 | |||
| Turnout | 3,640 | ||||
| Conservative gain from Labour | Swing | ||||
Death of Labour Cllr John Clancy.[29]
| Party | Candidate | Votes | % | ±% | |
|---|---|---|---|---|---|
| Conservative | Dominic Stanford | 2,728 | 48.7 | ||
| Labour | Elaine Kidney | 2,344 | 41.8 | ||
| Green | Peter Beck | 323 | 5.8 | ||
| Liberal Democrats | Stephanie Garrett | 182 | 3.2 | ||
| TUSC | Mia Wroe | 27 | 0.5 | ||
| Majority | 384 | 6.9 | |||
| Turnout | 5,604 | ||||
| Conservative gain from Labour | Swing | ||||
Resignation of Labour Cllr Sam Burden.
| Party | Candidate | Votes | % | ±% | |
|---|---|---|---|---|---|
| Labour | Liz Clements | 3,138 | 42.0 | ||
| Liberal Democrats | Tanveer Choudhry | 1,889 | 25.2 | ||
| Conservative | Obaid Khan | 1,683 | 22.5 | ||
| UKIP | Alan Blumenthal | 462 | 6.1 | ||
| Green | Gareth Courage | 307 | 4.1 | ||
| Majority | 1,249 | 16.7 | |||
| Turnout | 7,479 | 39.0 | |||
| Labour hold | Swing | ||||
Death of Lib Dem Cllr Ray Hassall.[31]
| Party | Candidate | Votes | % | ±% | |
|---|---|---|---|---|---|
| Liberal Democrats | Morriam Jan | 2,387 | 44.1 | ||
| Labour | Mohammed Hanif | 2,156 | 39.8 | ||
| Conservative | Minu Sungu | 558 | 10.3 | ||
| Green | Matthew Ford | 314 | 5.8 | ||
| Majority | 231 | 4.3 | |||
| Turnout | 5,415 | 33.7 | |||
| Liberal Democrats hold | Swing | ||||
Resignation of Labour Cllr Cath Grundy.
| Party | Candidate | Votes | % | ±% | |
|---|---|---|---|---|---|
| Conservative | Gary Sambrook | 1,571 | 47.0 | ||
| Labour | Lorraine Owen | 1,433 | 42.8 | ||
| UKIP | Roger Tempest | 266 | 7.9 | N/A | |
| Liberal Democrats | Graham Lippiatt | 43 | 1.3 | ||
| National Front | Terry Williams | 33 | 1.0 | ||
| Majority | 138 | 4.1 | |||
| Turnout | 3,355 | 19 | |||
| Conservative gain from Labour | Swing | ||||
| Party | Candidate | Votes | % | ±% | |
|---|---|---|---|---|---|
| Labour | Victoria Quinn | 3,932 | 56.7 | ||
| Respect | Mohammed Ishtiaq | 2,301 | 33.2 | ||
| Liberal Democrats | Adil Rashid | 395 | 5.7 | ||
| Green | Peter Tinsley | 179 | 2.6 | ||
| Conservative | Sahar Rezazadeh | 133 | 1.9 | ||
| Majority | 1,631 | 23.5 | |||
| Turnout | 6,965 | 33.0 | |||
| Labour gain from Respect | Swing | ||||
| Party | Candidate | Votes | % | ±% | |
|---|---|---|---|---|---|
| Conservative | David Barrie | 1,633 | 58.3 | ||
| Labour | Robert Pocock | 505 | 18.0 | ||
| UKIP | Maddy Westrop | 344 | 12.3 | ||
| Liberal Democrats | Robert Hardware | 319 | 11.4 | ||
| Majority | 1,128 | 40.3 | |||
| Turnout | 2,801 | 15.9 | |||
| Conservative hold | Swing | ||||
| Party | Candidate | Votes | % | ±% | |
|---|---|---|---|---|---|
| Respect | Shokat Ali | 2,495 | 39.6 | ||
| Labour | Mohammed Azim | 2,228 | 35.4 | ||
| Conservative | Abdul Kadir | 799 | 12.7 | ||
| Liberal Democrats | Naeem Qureshi | 506 | 8.0 | ||
| Green | Charles Alldrick | 213 | 3.4 | ||
| Independent | Sakander Mahmood | 55 | 0.9 | ||
| Majority | 267 | 4.2 | |||
| Turnout | 6,296 | 32.3 | |||
| Respect hold | Swing | ||||
| Party | Candidate | Votes | % | ±% | |
|---|---|---|---|---|---|
| Labour | Hendrina Quinnen | 3,018 | 42.2 | ||
| Liberal Democrats | Sabirul Islam | 2,000 | 28.0 | ||
| Conservative | Raja Khan | 1,622 | 22.7 | ||
| Green | Ankaret Harmer | 297 | 4.2 | ||
| UKIP | Melvin Ward | 208 | 2.9 | ||
| Majority | 1,018 | 14.2 | |||
| Turnout | 7,145 | 38.8 | |||
| Labour hold | Swing | ||||
| Party | Candidate | Votes | % | ±% | |
|---|---|---|---|---|---|
| Labour | Michael Leddy | 1,998 | 42.7 | ||
| Conservative | Ken Axford | 1,663 | 35.6 | ||
| BNP | Robert Purcell | 290 | 6.2 | ||
| Liberal Democrats | Brian Peace | 285 | 6.1 | ||
| Green | Anna Masters | 193 | 4.1 | ||
| Independent | Frank Chance | 157 | 3.4 | ||
| UKIP | Francois Jones | 64 | 1.4 | ||
| New Nationalist Party | Keith Axon | 25 | 0.5 | ||
| Majority | 335 | 7.1 | |||
| Turnout | 4,675 | 26.2 | |||
| Labour gain from Conservative | Swing | ||||
| Party | Candidate | Votes | % | ±% | |
|---|---|---|---|---|---|
| Labour | Lynda Clinton | 1,451 | 52.4 | ||
| Conservative | Gerald Brien | 982 | 35.5 | ||
| Liberal Democrats | John Line | 334 | 12.1 | ||
| Majority | 469 | 16.9 | |||
| Turnout | 2,767 | 15.0 | |||
| Labour hold | Swing | ||||
| Party | Candidate | Votes | % | ±% | |
|---|---|---|---|---|---|
| Liberal Democrats | Ayoub Khan | 2,081 | |||
| Liberal Democrats | Abdul Aziz | 2,044 | |||
| Liberal Democrats | Abdul Khalique | 1,905 | |||
| Labour | Ziaul Islam | 1,896 | |||
| Labour | Anthony Kennedy | 1,843 | |||
| Labour | Changese Khan | 1,578 | |||
| Conservative | Raja Iqbal | 282 | |||
| Green | Anna Dunstan | 182 | |||
| Conservative | David Williams-Masinda | 166 | |||
| Conservative | Mohammed Mushtaq | 148 | |||
| Turnout | 12,125 | 25.9 | |||
| Liberal Democrats gain from Labour | Swing | ||||
| Liberal Democrats gain from Labour | Swing | ||||
| Liberal Democrats gain from Labour | Swing | ||||
| Party | Candidate | Votes | % | ±% | |
|---|---|---|---|---|---|
| People's Justice | Shaukat Ali | 2,241 | |||
| Labour | Shafique Shah | 2,183 | |||
| People's Justice | Saeed Mohammed | 2,065 | |||
| People's Justice | Choudhry Ullah | 2,041 | |||
| Labour | Zulfiqar Khan | 2,009 | |||
| Labour | Stewart Stacey | 1,875 | |||
| Liberal Democrats | Qamar Nawaz | 1,372 | |||
| Liberal Democrats | Nazar Hussain | 1,117 | |||
| Liberal Democrats | Azad Aslam | 1,058 | |||
| Green | Alan Clawley | 314 | |||
| Conservative | David Fazakerley | 251 | |||
| Conservative | Mohammed Shariff-Malik | 154 | |||
| Conservative | Jasbir Singh | 153 | |||
| Turnout | 16,833 | 31.3 | |||
| People's Justice gain from Labour | Swing | ||||
| Labour hold | Swing | ||||
| People's Justice gain from Labour | Swing | ||||
| Party | Candidate | Votes | % | ±% | |
|---|---|---|---|---|---|
| Labour | Barry Henley | 4,162 | 37.4 | ||
| Liberal Democrats | Zaman Khan | 3,898 | 35.1 | ||
| Conservative | Barry Hands | 1,889 | 16.9 | ||
| Green | Stuart Masters | 1,184 | 10.6 | ||
| Majority | 264 | 2.3 | |||
| Turnout | 11,133 | 61.1 | |||
| Labour hold | Swing | ||||
| Party | Candidate | Votes | % | ±% | |
|---|---|---|---|---|---|
| Labour | Sarah-Jayne Plant | 1,377 | 43.0 | ||
| Liberal Democrats | Anthony Foley | 759 | 23.7 | ||
| Conservative | Derek Green | 512 | 16.0 | ||
| BNP | Robert Purcell | 503 | 15.7 | ||
| Socialist Alliance | Maria Werson | 48 | 1.5 | ||
| Majority | 618 | 19.3 | |||
| Turnout | 3,199 | 18.1 | |||
| Labour hold | Swing | ||||
| Party | Candidate | Votes | % | ±% | |
|---|---|---|---|---|---|
| Labour | 1,172 | 42.5 | |||
| Conservative | 1,044 | 37.9 | |||
| Liberal Democrats | 287 | 10.4 | |||
| UKIP | 255 | 9.2 | |||
| Majority | 128 | 4.6 | |||
| Turnout | 2,758 | 15.0 | |||
| Labour gain from Conservative | Swing | ||||
| Party | Candidate | Votes | % | ±% | |
|---|---|---|---|---|---|
| Labour | Michael Sharpe | 1,113 | 57.2 | ||
| Conservative | Craig Smeaton | 679 | 34.9 | ||
| Liberal Democrats | Emily Rohaise | 105 | 5.4 | ||
| Socialist Alliance | Steven Godward | 37 | 1.9 | ||
| UKIP | Alan Ware | 13 | 0.7 | ||
| Majority | 434 | 22.3 | |||
| Turnout | 1,947 | 16.6 | |||
| Labour hold | Swing | ||||
| Party | Candidate | Votes | % | ±% | |
|---|---|---|---|---|---|
| Labour | Matthew Redmond | 4,311 | 52.5 | ||
| Liberal Democrats | Penelope Wagg | 2,838 | 34.6 | ||
| Conservative | Paul Burke | 1,010 | 12.3 | ||
| Majority | 1,473 | 17.9 | |||
| Turnout | 8,159 | 48.2 | |||
| Labour gain from Liberal Democrats | Swing | ||||
Death of Labour Cllr David Wells.
| Party | Candidate | Votes | % | ±% | |
|---|---|---|---|---|---|
| Labour | Margaret Langley | 1,369 | 70.2 | ||
| Conservative | Paul Valdmanis | 432 | 22.1 | ||
| Justice for the Elderly | Christopher F S Rose | 229 | 11.7 | ||
| Liberal Democrats | Derek P Parsons | 148 | 7.6 | ||
| Majority | 937 | 48.1 | |||
| Turnout | 2,178 | 12.0 | |||
| Labour hold | Swing | ||||
Death of Labour Cllr Anthony Rust.
| Party | Candidate | Votes | % | ±% | |
|---|---|---|---|---|---|
| Conservative | Mike Whitby | 2,719 | 53.4 | ||
| Labour | Stephen Cormell | 1,859 | 36.5 | ||
| Liberal Democrats | Conall Boyle | 420 | 8.2 | ||
| Green | Peter Beck | 96 | 1.9 | ||
| Majority | 860 | 16.9 | |||
| Turnout | 5,094 | 29.0 | |||
| Conservative gain from Labour | Swing | ||||
| Party | Candidate | Votes | % | ±% | |
|---|---|---|---|---|---|
| Labour | 2,623 | 80.2 | |||
| Liberal Democrats | 426 | 13.0 | |||
| Conservative | 221 | 6.8 | |||
| Majority | 2,197 | 67.2 | |||
| Turnout | 3,270 | ||||
| Labour hold | Swing | ||||
| Party | Candidate | Votes | % | ±% | |
|---|---|---|---|---|---|
| Labour | 1,731 | 64.9 | |||
| Conservative | 700 | 26.3 | |||
| Liberal Democrats | 184 | 6.9 | |||
| BNP | 50 | 1.9 | |||
| Majority | 1,031 | 38.6 | |||
| Turnout | 2,665 | 16.4 | |||
| Labour hold | Swing | ||||
Death of Lib Dem Cllr Neil Biddlestone.
| Party | Candidate | Votes | % | ±% | |
|---|---|---|---|---|---|
| Liberal Democrats | James Whorwood | 3,134 | 59.9 | ||
| Labour | Brenden O'Brien | 1,626 | 31.1 | ||
| Conservative | Peter Osborn | 407 | 7.8 | ||
| UKIP | Alan Ware | 60 | 1.1 | ||
| Majority | 1,508 | 26.1 | |||
| Turnout | 5,227 | 26.2 | |||
| Liberal Democrats hold | Swing | ||||
| Party | Candidate | Votes | % | ±% | |
|---|---|---|---|---|---|
| Liberal Democrats | Barbara Jackson | 3,285 | 67.5 | ||
| Labour | Lewis Berry | 1,191 | 24.4 | ||
| Conservative | Bryan Brooke | 395 | 8.1 | ||
| Majority | 2,094 | 42.9 | |||
| Turnout | 4,871 | 27.5 | |||
| Liberal Democrats hold | Swing | ||||
Death of Labour Cllr Edward Rochford.
| Party | Candidate | Votes | % | ±% | |
|---|---|---|---|---|---|
| Labour | Anita Ward | 1,240 | 52.0 | ||
| Conservative | Barry Hands | 790 | 33.2 | ||
| Liberal Democrats | Sean Hagan | 352 | 14.8 | ||
| Majority | 450 | 18.9 | |||
| Turnout | 2,382 | 12.6 | |||
| Labour hold | Swing | ||||
Death of Labour Cllr Paul Haymeraj.
| Party | Candidate | Votes | % | ±% | |
|---|---|---|---|---|---|
| Labour | Douglas McCarrick | 3,268 | 62.0 | ||
| Small Heath Res | Kenneth Greaves | 920 | 17.5 | ||
| Conservative | Nasreen Kayani | 861 | 16.3 | ||
| Green | Alan Clawley | 181 | 3.4 | ||
| Natural Law | Tessa Portsmouth | 37 | 0.7 | ||
| Majority | 2,348 | 44.6 | |||
| Turnout | 5,267 | 25.6 | |||
| Labour hold | Swing | ||||
Death of Conservative Cllr Arthur Walker.
| Party | Candidate | Votes | % | ±% | |
|---|---|---|---|---|---|
| Labour | Richard Bashford | 2,919 | 46.6 | ||
| Conservative | Edward Grant | 2,625 | 41.9 | ||
| Liberal Democrats | Susan Sherwen | 529 | 8.4 | ||
| Green | Peter Beck | 195 | 3.1 | ||
| Majority | 294 | 0.1 | |||
| Turnout | 5,267 | 39.4 | |||
| Labour gain from Conservative | Swing | ||||
Death of Conservative Cllr Clare Fancote.
| Party | Candidate | Votes | % | ±% | |
|---|---|---|---|---|---|
| Conservative | John Hood | 3,539 | 45.8 | ||
| Liberal Democrats | Marie Cope | 3,118 | 40.3 | ||
| Labour | Frank Hooley | 797 | 10.3 | ||
| National Front | Louise Holland | 171 | 2.2 | ||
| Monster Raving Loony | Tessa Portsmouth | 104 | 1.4 | ||
| Majority | 421 | 0.1 | |||
| Turnout | 7,729 | 33.7 | |||
| Conservative hold | Swing | ||||
Resignation of Labour Cllr Khalid Mahmood.
| Party | Candidate | Votes | % | ±% | |
|---|---|---|---|---|---|
| Labour | Anthony Kennedy | 2,232 | 55.9 | ||
| Conservative | Aziz-ul Hassan | 1,306 | 32.7 | ||
| Liberal Democrats | Sean Hagan | 311 | 7.8 | ||
| Green | Charles Alldrick | 147 | 3.7 | ||
| Majority | 926 | 23.2 | |||
| Turnout | 3,996 | 24.0 | |||
| Labour hold | Swing | ||||
Resignation of Lib Dem Cllr Paul Shefield.
| Party | Candidate | Votes | % | ±% | |
|---|---|---|---|---|---|
| Liberal Democrats | Neil Biddlestone | 3,462 | 62.1 | ||
| Labour | Ian Jamieson | 1,407 | 25.2 | ||
| Conservative | Clifford Beasley | 705 | 12.6 | ||
| Majority | 2,055 | 36.8 | |||
| Turnout | 5,577 | 27.6 | |||
| Liberal Democrats hold | Swing | ||||
Resignation of Labour Cllr Fred Grattidge.
| Party | Candidate | Votes | % | ±% | |
|---|---|---|---|---|---|
| Labour | Stanley Yapp | 1,539 | 47.2 | ||
| Conservative | Leonard Kirby | 937 | 28.7 | ||
| Liberal Democrats | Nicola Henry | 782 | 24.0 | ||
| Majority | 602 | 18.4 | |||
| Turnout | 3,261 | 18.6 | |||
| Labour hold | Swing | ||||
| Party | Candidate | Votes | % | ±% | |
|---|---|---|---|---|---|
| Labour | Graham Vickers | 3,179 | |||
| Conservative | Donald Bailey | 1,770 | |||
| Liberal Democrats | Dennis Pearson | 1,716 | |||
| National Front | Reginald Barlow | 371 | |||
| Majority | 1,409 | ||||
| Turnout | |||||
| Labour hold | Swing | ||||
