Results maps
-
 2008 results map
 -
 2010 results map
 -
 2011 results map
 -
 2015 results map
 -
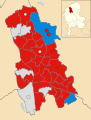
 2019 results map
 -
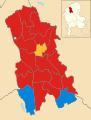
 2023 results map
Stoke-on-Trent City Council elections are held every four years. Stoke-on-Trent City Council is the local authority for the unitary authority of Stoke-on-Trent in the ceremonial county of Staffordshire, England. Since the last boundary changes in 2023, 44 councillors have been elected from 34 wards.[1]


| Party | Candidate | Votes | % | ±% | |
|---|---|---|---|---|---|
| Labour | Paul Sutton | 842 | 34.2 | -2.8 | |
| BNP | John West | 782 | 31.8 | +31.8 | |
| Independent | Donald McLean | 374 | 15.2 | +15.2 | |
| Conservative | Shaun Bennett | 249 | 10.1 | -3.0 | |
| Liberal Democrats | Maxine Morrow | 154 | 6.3 | +6.3 | |
| Socialist Alternative | Dave Frost | 61 | 2.5 | +2.5 | |
| Majority | 60 | ||||
| Turnout | 2,462 | ||||
| Labour gain from Independent | Swing | ||||
| Party | Candidate | Votes | % | ±% | |
|---|---|---|---|---|---|
| Independent | Edward Owen | 657 | 37.2 | +20.3 | |
| Labour | Terence Crowe | 432 | 24.5 | -10.7 | |
| Independent | Mohammed Ayub | 261 | 14.8 | +14.8 | |
| BNP | Michael Coleman | 162 | 9.2 | +9.2 | |
| Independent | Michael Farrington | 109 | 6.2 | +6.2 | |
| Conservative | Donald Smith | 92 | 5.2 | -1.3 | |
| Liberal Democrats | George Salmon | 51 | 2.9 | -4.6 | |
| Majority | 225 | 12.8 | |||
| Turnout | 1,764 | ||||
| Independent gain from Labour | Swing | ||||
| Party | Candidate | Votes | % | ±% | |
|---|---|---|---|---|---|
| Liberal Democrats | 525 | 25.2 | +12.8 | ||
| Labour | 496 | 23.8 | -7.1 | ||
| BNP | 465 | 22.3 | -3.0 | ||
| Independent | 445 | 21.4 | +21.4 | ||
| Conservative | 150 | 7.2 | -8.1 | ||
| Majority | 29 | 1.4 | |||
| Turnout | 2,081 | ||||
| Liberal Democrats gain from Labour | Swing | ||||
| Party | Candidate | Votes | % | ±% | |
|---|---|---|---|---|---|
| City Independents | Jackie Barnes | 370 | 34.90 | N/A | |
| Labour | Mubsira Aumir | 245 | 23.11 | ||
| Liberal Democrats | Les Porch | 152 | 14.33 | ||
| Conservative | Harold David Gregory | 109 | 10.28 | N/A | |
| UKIP | Michael Anthony Bedarsky | 105 | 9.90 | ||
| Independent | Gary Elsby | 36 | 3.39 | N/A | |
| BNP | Michael Coleman | 27 | 2.54 | N/A | |
| TUSC | Matt Wright | 14 | 1.32 | N/A | |
| Democratic Nationalist Party | Mark Leat | 2 | 0.18 | N/A | |
| Majority | 125 | ||||
| Turnout | 1,060 | 21.6 | |||
| City Independents gain from Labour | Swing | ||||
| Party | Candidate | Votes | % | ±% | |
|---|---|---|---|---|---|
| City Independents | Anthony Munday | 861 | 32.19 | ||
| Conservative | Sam Richardson | 504 | 18.84 | ||
| Labour | Candi Chetwynd | 444 | 16.60 | ||
| UKIP | Mick Harold | 333 | 12.45 | ||
| Independent | Gary Elsby | 313 | 11.70 | ||
| BNP | Michael Anthony White | 79 | 2.95 | ||
| Green | Adam William Colclough | 50 | 1.86 | ||
| Liberal Democrats | Tom Grocock | 32 | 1.19 | ||
| Independent | John Davis | 27 | 1.00 | ||
| TUSC | Liat James Norris | 25 | 0.93 | ||
| Majority | 357 | 13.35 | |||
| Turnout | 2,674 | 19.18 | |||
| City Independents gain from Labour | Swing | ||||
| Party | Candidate | Votes | % | ±% | ||
|---|---|---|---|---|---|---|
| Conservative | Tariq Mahmood | 769 | 49.16 | +9.56 | ||
| Labour | Javid Iqbal Najmi | 702 | 44.88 | -15.52 | ||
| TUSC | Andy Butcher | 77 | 4.92 | +4.92 | ||
| Majority | 67 | 4.28 | ||||
| Rejected ballots | 16 | 1.0 | ||||
| Turnout | 1,564 | 39.39 | ||||
| Conservative gain from Labour | ||||||
| Party | Candidate | Votes | % | ±% | |
|---|---|---|---|---|---|
| Conservative | Dean Richardson | 582 | 40.6 | +34.1 | |
| Labour | Lee Polshaw | 572 | 39.9 | -0.7 | |
| City Independents | Hazel Lyth | 171 | 11.9 | -32.6 | |
| Green | Adam Colclough | 109 | 7.6 | -0.8 | |
| Majority | 10 | 0.7 | |||
| Turnout | 1,434 | ||||
| Conservative gain from City Independents | Swing | ||||
| Party | Candidate | Votes | % | ±% | |
|---|---|---|---|---|---|
| Labour | Lynn Watkins | 469 | 62.5 | +29.8 | |
| City Independents | Sharon Edwards | 143 | 19.1 | -3.0 | |
| Conservative | Matthew Bridger | 138 | 18.4 | +9.5 | |
| Majority | 326 | 43.5 | |||
| Turnout | 750 | ||||
| Labour hold | Swing | ||||
