District result maps
-
 1999 results map
 -
 2003 results map
 -
 2007 results map
 -
 2011 results map
 -
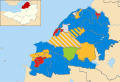
 2015 results map
 -
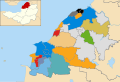 2019 results map
North Somerset Council is the local authority for the unitary authority of North Somerset, England. Until 1 April 1996 it was a non-metropolitan district called Woodspring, in the county of Avon.
| Political group | Councillors | |||||||
|---|---|---|---|---|---|---|---|---|
| 2003 | 2007 | 2011 | 2015 | 2019 | 2023[1] | Current | ||
| Conservative | 24 | 43 | 42 | 36 | 13 | 13 | 13 | |
| Independent | 3 | 6 | 7 | 6 | 12 | 8 | 7 | |
| Liberal Democrat | 23 | 5 | 6 | 4 | 10 | 9 | 9 | |
| Labour | 10 | 3 | 5 | 3 | 6 | 10 | 10 | |
| Green | 1 | 1 | 1 | 1 | 4 | 7 | 8 | |
| Portishead Independents | - | - | - | - | 4 | 3 | 3 | |
| Total | 61 | 61 | 61 | 50 | 50 | 50 | 50 | |


| Party | Candidate | Votes | % | ±% | |
|---|---|---|---|---|---|
| Labour | 1,232 | 58.1 | |||
| Liberal Democrats | 635 | 30.0 | |||
| Conservative | 178 | 8.4 | |||
| Independent | 74 | 3.5 | |||
| Majority | 597 | 28.1 | |||
| Turnout | 2,119 | 35.8 | |||
| Labour hold | Swing | ||||
| Party | Candidate | Votes | % | ±% | |
|---|---|---|---|---|---|
| Conservative | Ian Porter | 279 | 32.7 | -20.9 | |
| Liberal Democrats | Michael Bibb | 229 | 26.8 | -3.0 | |
| Independent | Anthony Horry | 196 | 23.0 | +23.0 | |
| Labour | Stephen Lyall | 149 | 17.5 | +1.0 | |
| Majority | 50 | 5.9 | |||
| Turnout | 853 | 36.0 | |||
| Conservative hold | Swing | ||||
| Party | Candidate | Votes | % | ±% | |
|---|---|---|---|---|---|
| Liberal Democrats | Mike Bell | 811 | 44.4 | +8.2 | |
| Conservative | Clive Webb | 651 | 35.9 | -9.0 | |
| Independent | Malcolm Timmis | 205 | 11.2 | +11.2 | |
| Labour | Chris Belton-Reed | 161 | 8.8 | -10.7 | |
| Majority | 160 | 8.5 | |||
| Turnout | 1,828 | 25.4 | |||
| Liberal Democrats gain from Conservative | Swing | ||||
| Party | Candidate | Votes | % | ±% | |
|---|---|---|---|---|---|
| Liberal Democrats | Peter Kehoe | 593 | 29.2 | -4.7 | |
| Conservative | Stanley Vyce | 534 | 26.3 | +6.7 | |
| Independent | Ralph James | 496 | 24.4 | -10.7 | |
| Labour | Douglas May | 410 | 20.2 | +8.8 | |
| Majority | 59 | 2.9 | |||
| Turnout | 2,033 | 29.2 | |||
| Liberal Democrats hold | Swing | ||||
| Party | Candidate | Votes | % | ±% | |
|---|---|---|---|---|---|
| Conservative | Carl Francis-Pester | 431 | 44.3 | -17.1 | |
| Liberal Democrats | Wendy Griggs | 369 | 37.9 | +15.0 | |
| Labour | Derek Waters | 174 | 17.9 | +2.2 | |
| Majority | 62 | 6.4 | |||
| Turnout | 974 | 44.0 | |||
| Conservative hold | Swing | ||||
| Party | Candidate | Votes | % | ±% | |
|---|---|---|---|---|---|
| Liberal Democrats | Michael Johnston | 476 | 43.8 | +4.0 | |
| Conservative | David Pasley | 434 | 39.9 | -20.3 | |
| UKIP | Anthony Butcher | 118 | 10.8 | +10.8 | |
| Labour | 59 | 5.4 | +5.4 | ||
| Majority | 42 | 3.9 | |||
| Turnout | 1,087 | 45.5 | |||
| Liberal Democrats gain from Conservative | Swing | ||||
| Party | Candidate | Votes | % | ±% | |
|---|---|---|---|---|---|
| Conservative | David Jolley | 488 | 38.9 | +20.8 | |
| Liberal Democrats | Jean Lord | 452 | 36.1 | +36.1 | |
| Labour | Patricia Gardener | 205 | 16.4 | +16.4 | |
| Independent | Reyna Knight | 108 | 8.6 | -73.3 | |
| Majority | 36 | 2.8 | |||
| Turnout | 1,253 | 49.0 | |||
| Conservative gain from Independent | Swing | ||||
| Party | Candidate | Votes | % | ±% | |
|---|---|---|---|---|---|
| Liberal Democrats | Wendy Griggs | 812 | 31.1 | +1.3 | |
| Independent | Anthony Moulin | 749 | 28.7 | -5.8 | |
| Conservative | Jill Iles | 678 | 26.0 | +3.5 | |
| Independent | Hilary Burn | 267 | 10.2 | +10.2 | |
| Labour | Bryan Moore | 104 | 4.0 | -9.1 | |
| Majority | 63 | 2.4 | |||
| Turnout | 2,610 | 38.4 | |||
| Liberal Democrats gain from Independent | Swing | ||||
| Party | Candidate | Votes | % | ±% | |
|---|---|---|---|---|---|
| Independent | Nanette Kirsen | 360 | 33.9 | +33.9 | |
| Labour | Pauline Robertson | 353 | 33.2 | -28.0 | |
| Liberal Democrats | David Neale | 202 | 19.0 | +3.4 | |
| Conservative | Anne-Marie Gregory | 147 | 13.8 | -9.3 | |
| Majority | 7 | 0.7 | |||
| Turnout | 1,062 | 40.0 | |||
| Independent gain from Labour | Swing | ||||
| Party | Candidate | Votes | % | ±% | |
|---|---|---|---|---|---|
| Conservative | Philip Judd | 946 | |||
| Conservative | Steven Edwards | 920 | |||
| Conservative | Marcia Pepperall | 904 | |||
| Liberal Democrats | Ronald Moon | 513 | |||
| Liberal Democrats | Richard Skinner | 498 | |||
| Liberal Democrats | Peter Hardaway | 494 | |||
| Labour | Barbara Francis | 268 | |||
| Labour | Brian Grace | 234 | |||
| Labour | Simon Stokes | 218 | |||
| Independent | Laurence Orme | 157 | |||
| UKIP | Mary Brown | 154 | |||
| Turnout | 5,306 | 26.6 | |||
| Conservative gain from Liberal Democrats | Swing | ||||
| Conservative gain from Liberal Democrats | Swing | ||||
| Conservative gain from Liberal Democrats | Swing | ||||
| Party | Candidate | Votes | % | ±% | |
|---|---|---|---|---|---|
| Conservative | Amratlal Patel | 478 | 27.5 | -33.6 | |
| Independent | John Ley-Morgan | 477 | 27.5 | +27.5 | |
| Liberal Democrats | Paula Howell | 421 | 24.3 | -4.1 | |
| Independent | Sidney Carter | 228 | 13.1 | +13.1 | |
| Labour | Josephine Bateman | 132 | 7.6 | -2.9 | |
| Majority | 1 | 0.1 | |||
| Turnout | 1,736 | 24.6 | |||
| Conservative hold | Swing | ||||
| Party | Candidate | Votes | % | ±% | |
|---|---|---|---|---|---|
| Conservative | Terence Porter | 1,411 | 64.9 | -4.2 | |
| Liberal Democrats | Jennifer Bindon | 511 | 23.5 | +2.8 | |
| Labour | Timothy Taylor | 253 | 11.6 | +1.4 | |
| Majority | 900 | 41.4 | |||
| Turnout | 2,175 | 42.7 | |||
| Conservative hold | Swing | ||||
| Party | Candidate | Votes | % | ±% | |
|---|---|---|---|---|---|
| Independent | Geoff Coombs | 816 | 61.7 | ||
| Conservative | Peter Burden | 314 | 23.7 | ||
| Labour | Terry Connell | 124 | 9.4 | ||
| Liberal Democrats | Nick Alderton | 69 | 5.2 | ||
| Majority | 502 | 37.9 | |||
| Turnout | 1,323 | 28.3 | |||
| Independent hold | Swing | ||||
| Party | Candidate | Votes | % | ±% | |
|---|---|---|---|---|---|
| Labour | Denise Estelle Hunt | 589 | 36.4 | ||
| Conservative | James Davies | 525 | 32.4 | ||
| Liberal Democrats | Alan Stuart Rice | 265 | 16.4 | ||
| Independent | Richard Geoffrey Skinner | 132 | 8.2 | ||
| UKIP | Anita Christine Maria Spencer-Johns | 108 | 6.7 | ||
| Majority | 64 | 0.4 | |||
| Turnout | 1,619 | 25.6 | |||
| Labour gain from North Somerset First Independents | |||||
| Party | Candidate | Votes | % | ±% | |
|---|---|---|---|---|---|
| Portishead Ind. | Caroline Davinia Goddard | 768 | 40.4 | -30.6 | |
| Conservative | David Harry Collingwood Oyns | 609 | 32.1 | +14.7 | |
| Liberal Democrats | Paul Anthony Welton | 303 | 16.0 | N/A | |
| Labour | Sophie Ann Davies | 219 | 11.5 | +3.2 | |
| Turnout | 1,899 | 34.15 | –1.81 | ||
| Registered electors | 5,701 | ||||
| Portishead Ind. hold | Swing | ||||
| Party | Candidate | Votes | % | ±% | |
|---|---|---|---|---|---|
| Green | Phil Neve | 594 | 64.5 | N/A | |
| Conservative | Samantha Pepperall | 270 | 29.3 | +15.7 | |
| Labour | Dawn Parry | 57 | 6.2 | -25.8 | |
| Majority | 324 | 35.2 | N/A | ||
| Turnout | 922 | 28.6 | -10.7 | ||
| Green gain from Liberal Democrats | Swing | ||||
