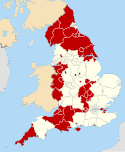
Stockton-on-Tees Borough Council elections are held every four years. Stockton-on-Tees Borough Council is the local authority for the unitary authority of Stockton-on-Tees, which straddles the ceremonial counties of County Durham and North Yorkshire, England. Until 1 April 1996 it was a non-metropolitan district in Cleveland.
An earlier municipal borough of Stockton-on-Tees had existed from 1836 until 1968.[1] That council was abolished and replaced by the short-lived County Borough of Teesside from 1968 to 1974. Under the Local Government Act 1972 a new non-metropolitan district called Stockton-on-Tees was established, with a larger territory than the pre-1968 borough.[2][3][4] The first election to the council was held in 1973, initially operating as a shadow authority before coming into its powers on 1 April 1974. County-level services were provided by Cleveland County Council until its abolition in 1996, when Stockton-on-Tees became a unitary authority. Political control of the council since 1973 has been held by the following parties:[5][6][7]
Non-metropolitan district
Party in control | Years | |
---|---|---|
Labour | 1973–1976 | |
Conservative | 1976–1979 | |
Labour | 1979–1991 | |
No overall control | 1991–1996 |
Unitary authority
Party in control | Years | |
---|---|---|
Labour | 1996–2005 | |
No overall control | 2005–2015 | |
Labour | 2015–2019 | |
No overall control | 2019–present |
The leaders of the council since 1990 have been:[8]
Councillor | Party | From | To | |
---|---|---|---|---|
Bob Gibson[9] | Labour | 1990 | 23 May 2007 | |
Ken Lupton[10] | Conservative | 23 May 2007 | 25 May 2011 | |
Bob Cook | Labour | 25 May 2011 |
Party | Candidate | Votes | % | ±% | |
---|---|---|---|---|---|
Labour | Ann Hatton | 1,620 | 64.4 | -18.0 | |
Liberal Democrats | Joan Hodgson | 536 | 21.3 | +12.2 | |
Conservative | Phyllis Scott | 358 | 14.2 | +5.6 | |
Majority | 1,084 | 43.1 | |||
Turnout | 2,514 | 60.1 | |||
Labour hold | Swing |
Party | Candidate | Votes | % | ±% | |
---|---|---|---|---|---|
Labour | Chris Coombs | 583 | 58.0 | -19.4 | |
Independent | Alex Bain | 196 | 19.5 | +19.5 | |
Conservative | Mark Daley | 143 | 14.2 | +1.5 | |
Liberal Democrats | Jonathan Wylie | 61 | 6.1 | -3.8 | |
Socialist | Patrick Graham | 23 | 2.3 | +2.3 | |
Majority | 387 | 38.5 | |||
Turnout | 1,006 | 22.2 | |||
Labour hold | Swing |
Party | Candidate | Votes | % | ±% | |
---|---|---|---|---|---|
Conservative | 1,056 | 42.6 | -12.0 | ||
Labour | 971 | 39.2 | +3.8 | ||
Liberal Democrats | 340 | 13.7 | +3.7 | ||
Independent | 91 | 3.7 | +3.7 | ||
Socialist Alliance | 20 | 0.8 | +0.8 | ||
Majority | 85 | 3.4 | |||
Turnout | 2,478 | ||||
Conservative hold | Swing |
Party | Candidate | Votes | % | ±% | |
---|---|---|---|---|---|
Liberal Democrats | Jennifer Apedaile | 886 | 56.6 | +4.5 | |
Labour | Sidney Thompson | 555 | 35.5 | -12.4 | |
Conservative | John Thomson | 123 | 7.9 | +7.9 | |
Majority | 331 | 21.1 | |||
Turnout | 1,564 | 25.0 | |||
Liberal Democrats hold | Swing |
Party | Candidate | Votes | % | ±% | |
---|---|---|---|---|---|
Liberal Democrats | Colin Leckonby | 1,169 | 67.1 | +10.5 | |
Labour | Royce Sandbach | 405 | 23.3 | -12.2 | |
Conservative | Graham Moore | 96 | 5.5 | -2.4 | |
Socialist Alternative | Anne Hollifield | 71 | 4.1 | +4.1 | |
Majority | 764 | 43.8 | |||
Turnout | 1,741 | 28.3 | |||
Liberal Democrats gain from Labour | Swing |
Party | Candidate | Votes | % | ±% | |
---|---|---|---|---|---|
Labour | Raymond McCall | 420 | 61.9 | -12.6 | |
Liberal Democrats | 132 | 19.5 | +3.7 | ||
Green | 65 | 9.6 | +9.6 | ||
Conservative | 61 | 9.0 | -0.7 | ||
Majority | 288 | 42.4 | |||
Turnout | 678 | 19.4 | |||
Labour hold | Swing |
Party | Candidate | Votes | % | ±% | |
---|---|---|---|---|---|
Conservative | Terence Laing | 1,396 | 78.1 | +12.3 | |
Labour | Joseph Rayner | 277 | 15.5 | -6.1 | |
Liberal Democrats | David Hamilton-Milburn | 115 | 6.4 | -6.3 | |
Majority | 1,119 | 62.6 | |||
Turnout | 1,788 | 32.6 | |||
Conservative hold | Swing |
Party | Candidate | Votes | % | ±% | |
---|---|---|---|---|---|
Ingleby Barwick Ind Society | Jean Kirby | 1,011 | 62.7 | -16.4 | |
Conservative | Kelvin Mirfin | 303 | 18.8 | +6.9 | |
Labour | Peter McCarrick | 163 | 10.1 | +1.1 | |
UKIP | Stuart Smitheringale | 82 | 5.1 | +5.1 | |
Liberal Democrats | Irene Machin | 54 | 3.3 | +3.3 | |
Majority | 708 | 43.9 | |||
Turnout | 1,613 | 22.2 | |||
Independent hold | Swing |
Party | Candidate | Votes | % | ±% | |
---|---|---|---|---|---|
Thornaby Independent Association | Mick MOORE | 800 | 61.2 | +8.1 | |
Labour | Leslie HODGE | 270 | 20.6 | -11.6 | |
UKIP | Ted STRIKE | 135 | 10.3 | +10.3 | |
Conservative | John CHAPMAN | 85 | 6.5 | -5.3 | |
Liberal Democrats | Isabel WILLIS | 18 | 1.4 | -1.5 | |
Majority | 530 | ||||
Turnout | |||||
Independent hold | Swing | 9.9 |
Party | Candidate | Votes | % | ±% | |
---|---|---|---|---|---|
Labour | Allan Mitchell | 598 | 52.5 | +6.7 | |
Conservative | Stephen Richardson | 363 | 31.9 | +4.8 | |
UKIP | Peter Braney | 113 | 9.9 | +9.9 | |
Liberal Democrats | Drew Durning | 65 | 5.7 | +0.2 | |
Majority | 235 | 20.6 | |||
Turnout | 1,139 | 21.9 | |||
Labour hold | Swing |
Party | Candidate | Votes | % | ±% | |
---|---|---|---|---|---|
Conservative | Stephen Richardson | 807 | 50.5 | +15.4 | |
Labour | Eleanor Clark | 689 | 43.1 | -5.5 | |
UKIP | Daniel Dalton | 58 | 3.6 | -8.8 | |
Liberal Democrats | Nick Webb | 44 | 2.8 | -1.1 | |
Majority | 118 | 7.4 | |||
Turnout | 1,598 | 30.8 | |||
Conservative gain from Labour | Swing |
Party | Candidate | Votes | % | ±% | |
---|---|---|---|---|---|
Labour | Marilyn Surtees | 483 | 52.5 | ||
Conservative | Miguel Rodrigues | 201 | 21.8 | ||
(no description) | David Kirk | 193 | 21.0 | ||
Liberal Democrats | Jason Rossiter | 43 | 4.7 | ||
Majority | 282 | 30.7 | |||
Turnout | 920 | 19.0 | |||
Labour hold | Swing |
Party | Candidate | Votes | % | ±% | |
---|---|---|---|---|---|
Conservative | Tony Hampton | 1,179 | 50.8 | ||
Independent | Andrew Sherris | 677 | 29.1 | ||
Labour | Kevin Nicholas | 394 | 17.0 | ||
Liberal Democrats | Graham Robinson | 73 | 3.1 | ||
Majority | 502 | 21.6 | |||
Turnout | 2,323 | 30.2 | |||
Conservative hold | Swing |
Party | Candidate | Votes | % | ±% | |
---|---|---|---|---|---|
Labour | Paul Weston | 719 | 40.5 | +5.4 | |
Conservative | Sam Linley | 687 | 38.7 | +19.1 | |
Independent | Jennifer Apedaile | 196 | 11.0 | n/a | |
Liberal Democrats | David Minchella | 95 | 5.3 | n/a | |
North East | Mark Burdon | 80 | 4.5 | n/a | |
Majority | 32 | 1.8 | |||
Turnout | 1,777 | 25.4 | |||
Labour hold | Swing |
Party | Candidate | Votes | % | ±% | |
---|---|---|---|---|---|
Labour Co-op | Louise Baldock | 727 | 54.7 | +2.2 | |
Conservative | Aidan Cockerill | 409 | 30.8 | -1.1 | |
Independent | Shakeel Noor | 156 | 11.7 | n/a | |
Liberal Democrats | Drew Durning | 37 | 2.8 | -2.9 | |
Majority | 318 | 23.9 | |||
Turnout | 1,329 | 24.2 | |||
Labour hold | Swing |
Party | Candidate | Votes | % | ±% | |
---|---|---|---|---|---|
Conservative | Lee Spence | 863 | 39.6 | +11.3 | |
Independent | Mark Bellerby | 791 | 36.3 | 36.3 | |
Labour | Paul Jenkins | 429 | 19.7 | -1.2 | |
Reform UK | John McDermottroe | 53 | 2.4 | +2.4 | |
Independent | Paul Henderson | 32 | 1.5 | +1.5 | |
Liberal Democrats | Raymond Penn | 7 | 0.3 | +0.3 | |
Independent | Giles Harris | 4 | 0.2 | +0.2 | |
Majority | 72 | 3.3 | |||
Turnout | 2,179 | ||||
Conservative gain from Independent | Swing |
Party | Candidate | Votes | % | ±% | |
---|---|---|---|---|---|
Conservative | Hugo Stratton | 1,055 | 45.2 | +28.4 | |
Liberal Democrats | Matthew Eves | 730 | 31.3 | -14.4 | |
Labour | Ben Lamb | 386 | 16.5 | -3.6 | |
Independent | Craig Harker | 165 | 7.1 | +7.1 | |
Majority | 325 | 13.9 | |||
Turnout | 2,336 | ||||
Conservative gain from Liberal Democrats | Swing |
Party | Candidate | Votes | % | ±% | |
---|---|---|---|---|---|
Conservative | Niall Innes | 1,999 | 73.2 | +4.6 | |
Labour | Shakeel Hussain | 620 | 22.7 | +4.6 | |
Reform UK | Michael Elliott | 112 | 4.1 | +4.1 | |
Majority | 1,379 | 50.5 | |||
Turnout | 2,731 | ||||
Conservative hold | Swing |
Party | Candidate | Votes | % | ±% | |
---|---|---|---|---|---|
Conservative | Steve Matthews | 928 | 65.1 | +9.4 | |
Labour | Stephen Thompson | 362 | 25.4 | -0.8 | |
Independent | Andrew Stephenson | 136 | 9.5 | -46.2 | |
Majority | 566 | 39.7 | |||
Turnout | 1,426 | ||||
Conservative hold | Swing |
Andrew Stephenson was the incumbent councillor, having been disqualified due to non-attendance.[37]
Party | Candidate | Votes | % | ±% | |
---|---|---|---|---|---|
Conservative | Dan Fagan | 2,757 | 62.0 | +26.4 | |
Independent | Alan Gallafant | 759 | 17.1 | +17.1 | |
Labour | Gail Chandler | 644 | 14.5 | -2.9 | |
Independent | Tony Bell-Berry | 149 | 3.4 | +3.4 | |
Liberal Democrats | Adam Kearney | 76 | 1.7 | +1.7 | |
Independent | Christopher Johnson | 59 | 1.3 | +1.3 | |
Majority | 1,998 | 45.0 | |||
Turnout | 4,444 | ||||
Conservative hold | Swing |