| |||||||||||||||||||||||||||||||||||||||||||||||||||||||||||||||||||||||||||||||||||||||||||||
All 39 seats to Spelthorne Borough Council 20 seats needed for a majority | |||||||||||||||||||||||||||||||||||||||||||||||||||||||||||||||||||||||||||||||||||||||||||||
---|---|---|---|---|---|---|---|---|---|---|---|---|---|---|---|---|---|---|---|---|---|---|---|---|---|---|---|---|---|---|---|---|---|---|---|---|---|---|---|---|---|---|---|---|---|---|---|---|---|---|---|---|---|---|---|---|---|---|---|---|---|---|---|---|---|---|---|---|---|---|---|---|---|---|---|---|---|---|---|---|---|---|---|---|---|---|---|---|---|---|---|---|---|
Registered | 77,255 | ||||||||||||||||||||||||||||||||||||||||||||||||||||||||||||||||||||||||||||||||||||||||||||
Turnout | 24,293 (31.4%) | ||||||||||||||||||||||||||||||||||||||||||||||||||||||||||||||||||||||||||||||||||||||||||||
| |||||||||||||||||||||||||||||||||||||||||||||||||||||||||||||||||||||||||||||||||||||||||||||
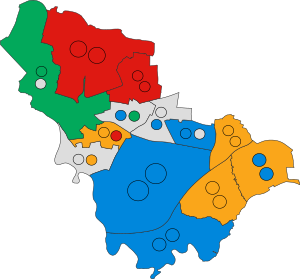
Winner of each seat at the 2023 Spelthorne Borough Council election | |||||||||||||||||||||||||||||||||||||||||||||||||||||||||||||||||||||||||||||||||||||||||||||
|
The 2023 Spelthorne Borough Council election took place on 4 May 2023 to elect members of Spelthorne Borough Council in Surrey, England.[2] This was on the same day as other local elections across England.
Prior to the election the council was under no overall control, being led by a Conservative minority administration. The Conservatives had won a majority of the seats at the previous election in 2019 but had lost their majority in 2020 following a number of defections.[3] Following the 2023 election the council remained under no overall control. At the subsequent annual council meeting on 25 May 2023, independent councillor Jo Sexton was appointed leader of the council, with Liberal Democrat councillor Chris Bateson serving as deputy leader.[4]
2023 Spelthorne Borough Council election | ||||||||||
---|---|---|---|---|---|---|---|---|---|---|
Party | Candidates | Seats | Gains | Losses | Net gain/loss | Seats % | Votes % | Votes | +/− | |
Conservative | 39 | 12 | 0 | 12 | 11 | 30.7 | 38.6 | 24,720 | –7.7 | |
Liberal Democrats | 14 | 10 | 2 | 0 | 2 | 25.6 | 18.6 | 11,893 | +1.1 | |
Independent | 18 | 7 | 5 | 0 | 5 | 17.9 | 17.7 | 11,363 | +13.6 | |
Labour | 14 | 7 | 6 | 1 | 3 | 17.9 | 13.6 | 8,696 | –2.3 | |
Green | 10 | 3 | 4 | 0 | 1 | 7.7 | 10.8 | 6,927 | +2.0 | |
TUSC | 3 | 0 | 0 | 0 | 0.0 | 0.1 | 37 | N/A | ||
Reform UK | 2 | 0 | 0 | 0 | 0.0 | 0.5 | 350 | N/A |
The results were declared on the 5 May 2023.[5][6] The results were as follows, with an asterisk (*) indicating an incumbent councillor standing for re-election:[1]
Party | Candidate | Votes | % | ±% | |
---|---|---|---|---|---|
Conservative | Simon Bhadye | 783 | 40.7 | -10.9 | |
Conservative | Naz Islam | 781 | 40.6 | -6.0 | |
Independent | Katherine Rutherford | 773 | 40.2 | N/A | |
Conservative | Jugjit Matharu | 709 | 36.9 | -4.7 | |
Independent | David Alexander | 706 | 36.7 | N/A | |
Labour | Andrew Lamb | 491 | 25.5 | +5.2 | |
Liberal Democrats | Alan Mockford | 490 | 25.5 | +4.4 | |
Rejected ballots | 6 | ||||
Turnout | 1,929 | 29.8 | +2.7 | ||
Conservative hold | |||||
Independent gain from Conservative |
Party | Candidate | Votes | % | ±% | |
---|---|---|---|---|---|
Independent | Joanne Sexton** | 991 | 50.7 | N/A | |
Independent | Elizabeth Baldock | 776 | 39.7 | N/A | |
Conservative | Rose Chandler* | 714 | 36.5 | -8.3 | |
Conservative | Keith Robinson | 615 | 31.5 | -15.4 | |
Conservative | Vandana Tuteja | 544 | 27.8 | -14.7 | |
Independent | John Enright | 467 | 23.9 | N/A | |
Labour | Gerald Dare | 442 | 22.6 | +1.4 | |
Green | Chris Hyde | 319 | 16.3 | -12.2 | |
Independent | Gerald Gravett | 265 | 13.6 | N/A | |
Green | Nigel Scott | 253 | 12.8 | N/A | |
Rejected ballots | 3 | ||||
Turnout | 1,958 | 33.3 | |||
Independent gain from Conservative | |||||
Conservative hold |
Joanne Sexton was an incumbent in Ashford North and Stanwell South
Party | Candidate | Votes | % | ±% | |
---|---|---|---|---|---|
Labour | Sean Beatty | 728 | 43.3 | +7.9 | |
Labour | Rebecca Geach | 695 | 41.3 | +6.0 | |
Labour | Med Buck | 671 | 39.9 | +7.8 | |
Conservative | Sonia Maya | 511 | 30.4 | -13.5 | |
Conservative | Amar Brar* | 506 | 30.1 | -7.8 | |
Conservative | Julie Fegredo | 497 | 29.5 | -10.4 | |
Independent | Chris Davies | 421 | 25.0 | N/A | |
Independent | Jason Lane | 395 | 23.5 | N/A | |
Reform UK | Marian Rough | 178 | 10.6 | N/A | |
Rejected ballots | 4 | ||||
Turnout | 1,687 | 25.0 | +2.7 | ||
Labour gain from Conservative | |||||
Labour gain from Conservative |
Party | Candidate | Votes | % | ±% | |
---|---|---|---|---|---|
Independent | Michelle Arnold | 801 | 39.2 | N/A | |
Conservative | Olivia Rybinski* | 725 | 35.5 | -8.9 | |
Green | Andrew McLuskey | 677 | 33.1 | -1.1 | |
Conservative | Nick Gething* | 653 | 31.9 | -17.0 | |
Conservative | Paul Woodward | 651 | 31.8 | -11.5 | |
Labour | Mark Kluth | 571 | 27.9 | -3.8 | |
Green | Dene Winch | 548 | 26.8 | +4.8 | |
Independent | Robin Henfrey | 519 | 25.4 | N/A | |
Independent | Quentin Edgington | 499 | 24.4 | N/A | |
Rejected ballots | 1 | ||||
Turnout | 2,046 | 34.4 | |||
Independent gain from Conservative | |||||
Conservative hold | |||||
Green gain from Conservative |
Party | Candidate | Votes | % | ±% | |
---|---|---|---|---|---|
Liberal Democrats | Sandra Dunn* | 1,014 | 63.5 | +9.5 | |
Liberal Democrats | Lawrence Nichols* | 921 | 57.6 | +14.4 | |
Liberal Democrats | John Turner | 833 | 52.1 | +4.6 | |
Conservative | Michael Brennan | 489 | 30.6 | -1.7 | |
Conservative | Anna Nowicka | 489 | 30.6 | +2.1 | |
Conservative | Paul Robigo | 477 | 29.8 | +0.8 | |
Labour | Roger Bowen | 281 | 17.6 | +6.0 | |
Rejected ballots | 12 | ||||
Turnout | 1,610 | 32.7 | –3.7 | ||
Liberal Democrats hold | |||||
Liberal Democrats hold |
Party | Candidate | Votes | % | ±% | |
---|---|---|---|---|---|
Conservative | Karen Howkins* | 945 | 50.2 | -1.4 | |
Conservative | Darren Clarke | 878 | 46.6 | +3.3 | |
Conservative | Anant Mathur | 710 | 37.7 | -3.7 | |
Green | Stuart Whitmore* | 673 | 35.7 | +7.1 | |
Green | Jill Beecher | 614 | 32.6 | N/A | |
Liberal Democrats | John Thesiger | 470 | 25.0 | +1.4 | |
Labour | Pierre Cooper | 378 | 20.1 | -0.3 | |
Independent | John Johnston | 192 | 10.2 | N/A | |
TUSC | Andy Pattinson | 65 | 3.5 | N/A | |
TUSC | Helen Couchman | 55 | 2.9 | N/A | |
TUSC | Paul Couchman | 37 | 2.0 | N/A | |
Rejected ballots | 9 | ||||
Turnout | 1,892 | 30.2 | +1.5 | ||
Conservative hold | |||||
Conservative hold |
Party | Candidate | Votes | % | ±% | |
---|---|---|---|---|---|
Independent | Denise Saliagopoulos* | 1,191 | 56.1 | +8.0 | |
Independent | Daniel Geraci | 1,046 | 49.3 | N/A | |
Liberal Democrats | Michele Gibson* | 1,022 | 48.1 | +9.6 | |
Conservative | Sinead Mooney* | 754 | 35.5 | -3.0 | |
Conservative | Keith Malcouronne | 661 | 31.1 | -3.3 | |
Conservative | Michael Zenonos | 619 | 29.2 | +1.2 | |
Rejected ballots | 5 | ||||
Turnout | 2,128 | 39.6 | |||
Independent hold | |||||
Independent gain from Conservative | |||||
Liberal Democrats gain from Conservative |
Party | Candidate | Votes | % | ±% | |
---|---|---|---|---|---|
Conservative | Maureen Attewell** | 1,194 | 57.6 | -1.9 | |
Conservative | Lisa Brennan | 955 | 46.0 | -8.6 | |
Conservative | John Boughtflower** | 920 | 44.4 | -8.6 | |
Green | Peter Hughes | 694 | 33.5 | +6.6 | |
Liberal Democrats | Martin Gammon | 672 | 32.4 | +12.0 | |
Labour Co-op | Stephen Bentley | 555 | 26.8 | +14.4 | |
Independent | Sue Bryer | 423 | 20.4 | N/A | |
Rejected ballots | 8 | ||||
Turnout | 2,082 | 36.9 | –2.8 | ||
Conservative hold | |||||
Conservative hold |
Maureen Attewell was a sitting councillor for Laleham and Shepperton Green John Boughtflower was a sitting councillor for Ashford East
Party | Candidate | Votes | % | ±% | |
---|---|---|---|---|---|
Green | Malcolm Beecher* | 1,222 | 57.4 | +5.1 | |
Green | Adam Gale | 1,169 | 54.9 | +7.3 | |
Independent | Howard Williams | 942 | 44.2 | N/A | |
Labour | Khalid Mustafa | 740 | 34.7 | +0.9 | |
Conservative | Mark Francis | 537 | 25.2 | -8.5 | |
Conservative | Trudy Burgess | 474 | 22.3 | -11.0 | |
Conservative | Adrian Ulisse | 343 | 16.1 | -16.3 | |
Rejected ballots | 9 | ||||
Turnout | 2,139 | 31.2 | +1.3 | ||
Green hold | |||||
Green hold | |||||
Independent gain from Labour |
Party | Candidate | Votes | % | ±% | |
---|---|---|---|---|---|
Liberal Democrats | Chris Bateson* | 1,171 | 71.3 | +21.5 | |
Liberal Democrats | Jolyon Caplin | 1,064 | 64.8 | +16.5 | |
Labour | Tony Burrell | 769 | 46.8 | +17.0 | |
Conservative | Kathy Hurst | 437 | 26.6 | +1.0 | |
Conservative | Maurice Watts | 383 | 23.3 | ±0.0 | |
Conservative | Graeme Reid | 337 | 20.5 | -2.8 | |
Rejected ballots | 7 | ||||
Turnout | 1,649 | 30.9 | +0.5 | ||
Liberal Democrats hold | |||||
Labour hold |
Party | Candidate | Votes | % | ±% | |
---|---|---|---|---|---|
Labour | Susan Doran* | 804 | 53.1 | +8.5 | |
Labour | Jon Button* | 798 | 52.7 | +16.3 | |
Labour | John Doran* | 773 | 51.0 | +8.8 | |
Conservative | Anita McIlroy | 632 | 41.7 | +9.8 | |
Conservative | Jim McIlroy | 621 | 41.0 | +1.3 | |
Conservative | Rohan Vijjhalwar | 476 | 31.4 | +5.3 | |
Rejected ballots | 13 | ||||
Turnout | 1,528 | 25.8 | –1.6 | ||
Labour hold | |||||
Labour gain from Conservative | |||||
Labour hold |
Party | Candidate | Votes | % | ±% | |
---|---|---|---|---|---|
Liberal Democrats | Harry Boparai | 828 | 53.0 | +17.5 | |
Liberal Democrats | Mary Bing Dong | 740 | 47.4 | +15.9 | |
Liberal Democrats | Suraj Gyawali | 648 | 41.5 | +19.8 | |
Independent | Ian Beardsmore* | 608 | 38.9 | -7.9 | |
Independent | Jacqueline Stanton | 348 | 22.3 | N/A | |
Conservative | Simon Rollo | 347 | 22.2 | -7.3 | |
Conservative | Jayson Bhadye | 283 | 18.1 | -1.1 | |
Conservative | Alex Sapunovas | 227 | 14.5 | -3.6 | |
Reform UK | Rory O'Brien | 172 | 11.0 | N/A | |
Rejected ballots | 5 | ||||
Turnout | 1,562 | 25.7 | –3.0 | ||
Liberal Democrats gain from Independent | |||||
Liberal Democrats hold | |||||
Liberal Democrats hold |
Party | Candidate | Votes | % | ±% | |
---|---|---|---|---|---|
Liberal Democrats | Kathy Grant* | 1,068 | 51.6 | +8.7 | |
Conservative | Buddhi Weerasinghe | 967 | 46.7 | -1.5 | |
Conservative | Matthew Lee | 960 | 46.4 | -0.9 | |
Liberal Democrats | Michael Alexiou | 952 | 46.0 | +7.6 | |
Conservative | Jay Patel | 852 | 41.1 | -1.2 | |
Green | Daniel Dollin | 758 | 36.6 | N/A | |
Rejected ballots | 12 | ||||
Turnout | 2,083 | 35.6 | +3.0 | ||
Liberal Democrats hold | |||||
Conservative hold | |||||
Conservative hold |
Party | Candidate | Votes | % | ±% | |
---|---|---|---|---|---|
Conservative | Paul Norman Woodward | 562 | 37.5 | +5.7 | |
Independent | John Anthony Cornelius Enright | 420 | 28.0 | N/A | |
Green | Stuart John Whitmore | 252 | 16.8 | -16.3 | |
Labour | Mark Joseph Kluth | 212 | 14.1 | -13.8 | |
Reform UK | Rory O'Brien | 35 | 2.3 | N/A | |
TUSC | Paul Dennis Couchman | 19 | 1.3 | N/A | |
Turnout | 25.13 | ||||
Conservative gain from Green |
By-election triggered by the resignation of Green councillor Andrew McLuskey.[7][8]