Allegheny County | |
|---|---|
.jpg) | |
 Flag  Seal | |
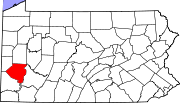
 Location within the U.S. state of Pennsylvania | |
 Pennsylvania's location within the U.S. | |
| Coordinates: 40°26′08″N 80°01′28″W / 40.4356°N 80.0244°W | |
| Country | |
| State | |
| Founded | September 24, 1788 |
| Named for | Allegheny River |
| Seat | Pittsburgh |
| Largest city | Pittsburgh |
| Area | |
| • Total | 745 sq mi (1,930 km2) |
| • Land | 730 sq mi (1,900 km2) |
| • Water | 14 sq mi (40 km2) 1.9% |
| Population (2020) | |
| • Total | 1,250,578 |
| • Density | 1,700/sq mi (700/km2) |
| Time zone | UTC−5 (Eastern) |
| • Summer (DST) | UTC−4 (EDT) |
| Congressional districts | 12th, 17th |
| Website | www |
| Designated | December 30, 1982[1] |

Allegheny County (/ˌælɪˈɡeɪni/ AL-ig-AY-nee) is a county in Pennsylvania, United States. As of the 2020 census, the population was 1,250,578, making it the state's second-most populous county, after Philadelphia County. Its county seat and most populous city is Pittsburgh, Pennsylvania's second most populous city.[2] The county is part of the Greater Pittsburgh region of the state[a], and is the center of the Pittsburgh media market.
Allegheny was the first county in Pennsylvania to be given a Native American name. It was named after the Lenape word for the Allegheny River. The meaning of "Allegheny" is uncertain. It is usually said to mean "fine river". Stewart says that the name may come from a Lenape account of an ancient mythical tribe called "Allegewi", who lived along the river before being taken over by the Lenape.[3]


Prior to European contact, this area was settled for thousands of years by succeeding cultures of indigenous peoples. During the colonial era, historic native groups known by the colonists to settle in the area included members of western nations of the Iroquois, such as the Seneca; the Lenape, who had been pushed from the East by European-American settlers; the Shawnee, who also had territory in Ohio; and the Mingo, a group made up of a variety of peoples from more eastern tribes.
European fur traders such as Peter Chartier established trading posts in the region in the early eighteenth century.
In 1749, Captain Pierre Joseph Céloron de Blainville claimed the Ohio Valley and all of western Pennsylvania for King Louis XV of France. The captain traveled along the Ohio and Allegheny rivers. He installed lead plates in the ground to mark the land for France.
Most of the towns during that era were developed along waterways, which were the primary transportation routes, as well as providing water for domestic uses. Through the eighteenth century, both the French and the British competed for control over the local rivers in this frontier territory of North America. Native American bands and tribes allied with the colonists to differing degrees, often based on their trading relationships. The British sent Major George Washington to expel the French from their posts, with no success. He also nearly drowned in the ice-filled Allegheny River while returning to camp.
The English tried again in 1754 to establish a post in the area. They sent 41 Virginians to build Fort Prince George. The French learned of the plan and sent an army to capture the fort. They resumed building it and added increased defensive fortification, renaming it as Fort Duquesne.
Given its strategic location at the Ohio, Fort Duquesne became an important focal point of the French and Indian War. The first British attempt to retake the fort, the Braddock Expedition, failed miserably.[4] In 1758 British forces under General John Forbes recaptured the fort; he had it destroyed to prevent any use by the French. The British built a new, larger fort on the site, including a moat, and named it Fort Pitt. The historic site has been preserved as Pittsburgh's Point State Park.
Under their colonial charters, both Pennsylvania and Virginia claimed the region that is now Allegheny County. Pennsylvania administered most of the region as part of its Westmoreland County. Virginia considered everything south of the Ohio River and east of the Allegheny River to be part of its Yohogania County, and governed it from Fort Dunmore. In addition, parts of the county were located in the proposed British colony of Vandalia and the proposed U.S. state of Westsylvania. The overlapping boundaries, multiple governments, and confused deed claims soon proved unworkable. Near the end of the American Revolutionary War, in 1780 Pennsylvania and Virginia agreed to extend the Mason–Dixon line westward. This region was assigned to Pennsylvania. From 1781 until 1788, much of what Virginia had claimed as part of Yohogania County was administered as a part of the newly created Washington County, Pennsylvania.
Allegheny County was officially created on September 24, 1788, from parts of Washington and Westmoreland counties. It was formed to respond to pressure from the increase in settlers living in the area around Pittsburgh; this was designated as the county seat in 1791. The county originally extended north to the shores of Lake Erie; it was reduced to its current borders by 1800. As population increased in the territory, other counties were organized.
In the 1790s, the United States federal government imposed a whiskey excise tax. Farmers who had depended on whiskey income refused to pay and started the so-called Whiskey Rebellion after driving off tax collector John Neville. After a series of demonstrations by farmers, President George Washington sent troops to suppress the frontier rebellion.
The area developed rapidly through the 1800s with industrialization. It became the nation's prime steel producer by the late 19th century and Pittsburgh was nicknamed "Steel Capital of the World".
In 1913, the county's 125th anniversary was celebrated with a week-long series of events. The final day, September 27, was marked by a steamboat parade of 30 paddle wheelers. They traveled from Monongahela Wharf down the Ohio to the Davis Island Dam. The boats in line were the Steel City (formerly the Pittsburgh and Cincinnati packet Virginia), the flag ship; City of Parkersburg, Charles Brown, Alice Brown, Exporter, Sam Brown, Boaz, Raymond Horner, Swan, Sunshine, I. C. Woodward, Cruiser, Volunteer, A. R. Budd, J. C. Risher, Clyde, Rival, Voyager, Jim Brown, Rover, Charlie Clarke, Robt. J. Jenkins, Slipper, Bertha, Midland Sam Barnum, Cadet, Twilight, and Troubadour.[5]
On October 27, 2018, during a Sabbath course and a Torah study a domestic terrorist attack occurred at the Tree of Life – Or L'Simcha Congregation killing 11 people and harming six others, marking it one of the deadliest terrorist attacks in Pennsylvania history.
According to the U.S. Census Bureau, the county has a total area of 745 square miles (1,930 km2), of which 730 square miles (1,900 km2) is land and 14 square miles (36 km2) (1.9%) is water.[6]
Three major rivers traverse Allegheny County: the Allegheny River and the Monongahela River converge at Downtown Pittsburgh to form the Ohio River. The Youghiogheny River flows into the Monongahela River at McKeesport, 10 miles (16 km) to the southeast. There are several islands in these courses. The rivers drain via the Mississippi River into the Gulf of Mexico. Although the county's industrial growth resulted in clearcutting of the area's forests at one time, there has been regrowth and a significant woodland remains.
Allegheny has a humid continental climate which is hot-summer, (Dfa) except in higher elevations, where it is warm-summer (Dfb).
| Climate data for Pittsburgh (Pittsburgh International Airport), 1991–2020 normals,[b] extremes 1874–present[c] | |||||||||||||
|---|---|---|---|---|---|---|---|---|---|---|---|---|---|
| Month | Jan | Feb | Mar | Apr | May | Jun | Jul | Aug | Sep | Oct | Nov | Dec | Year |
| Record high °F (°C) | 75 (24) |
78 (26) |
84 (29) |
90 (32) |
95 (35) |
98 (37) |
103 (39) |
103 (39) |
102 (39) |
91 (33) |
82 (28) |
74 (23) |
103 (39) |
| Mean maximum °F (°C) | 61.5 (16.4) |
63.2 (17.3) |
73.5 (23.1) |
81.5 (27.5) |
86.8 (30.4) |
90.4 (32.4) |
91.3 (32.9) |
90.3 (32.4) |
88.2 (31.2) |
79.9 (26.6) |
70.8 (21.6) |
62.6 (17.0) |
92.6 (33.7) |
| Mean daily maximum °F (°C) | 36.3 (2.4) |
39.6 (4.2) |
49.1 (9.5) |
62.4 (16.9) |
71.9 (22.2) |
79.4 (26.3) |
82.9 (28.3) |
81.7 (27.6) |
75.1 (23.9) |
63.1 (17.3) |
50.9 (10.5) |
40.6 (4.8) |
61.1 (16.2) |
| Daily mean °F (°C) | 28.8 (−1.8) |
31.4 (−0.3) |
39.7 (4.3) |
51.5 (10.8) |
61.2 (16.2) |
69.4 (20.8) |
73.2 (22.9) |
71.8 (22.1) |
64.9 (18.3) |
53.4 (11.9) |
42.6 (5.9) |
33.7 (0.9) |
51.8 (11.0) |
| Mean daily minimum °F (°C) | 21.4 (−5.9) |
23.2 (−4.9) |
30.3 (−0.9) |
40.7 (4.8) |
50.6 (10.3) |
59.3 (15.2) |
63.4 (17.4) |
62.0 (16.7) |
54.8 (12.7) |
43.7 (6.5) |
34.3 (1.3) |
26.7 (−2.9) |
42.5 (5.8) |
| Mean minimum °F (°C) | 1.0 (−17.2) |
5.0 (−15.0) |
11.7 (−11.3) |
25.4 (−3.7) |
35.6 (2.0) |
45.2 (7.3) |
52.5 (11.4) |
51.1 (10.6) |
41.2 (5.1) |
29.5 (−1.4) |
19.3 (−7.1) |
9.7 (−12.4) |
−1.5 (−18.6) |
| Record low °F (°C) | −22 (−30) |
−20 (−29) |
−5 (−21) |
11 (−12) |
26 (−3) |
34 (1) |
42 (6) |
39 (4) |
31 (−1) |
16 (−9) |
−1 (−18) |
−12 (−24) |
−22 (−30) |
| Average precipitation inches (mm) | 2.96 (75) |
2.62 (67) |
3.15 (80) |
3.32 (84) |
3.83 (97) |
4.12 (105) |
4.26 (108) |
3.52 (89) |
3.30 (84) |
2.83 (72) |
2.86 (73) |
2.84 (72) |
39.61 (1,006) |
| Average snowfall inches (cm) | 13.3 (34) |
11.7 (30) |
7.6 (19) |
1.0 (2.5) |
0.0 (0.0) |
0.0 (0.0) |
0.0 (0.0) |
0.0 (0.0) |
0.0 (0.0) |
0.4 (1.0) |
2.4 (6.1) |
7.7 (20) |
44.1 (112) |
| Average precipitation days (≥ 0.01 in) | 16.8 | 13.9 | 14.0 | 13.9 | 13.5 | 12.4 | 11.2 | 10.5 | 9.8 | 11.1 | 12.0 | 14.6 | 153.7 |
| Average snowy days (≥ 0.1 in) | 12.2 | 9.3 | 5.9 | 1.6 | 0.0 | 0.0 | 0.0 | 0.0 | 0.0 | 0.3 | 3.3 | 7.6 | 40.2 |
| Average relative humidity (%) | 69.9 | 67.3 | 64.1 | 59.8 | 63.4 | 66.2 | 68.8 | 71.2 | 72.0 | 68.3 | 70.2 | 71.9 | 67.8 |
| Average dew point °F (°C) | 17.2 (−8.2) |
18.9 (−7.3) |
26.8 (−2.9) |
34.5 (1.4) |
45.9 (7.7) |
55.2 (12.9) |
60.1 (15.6) |
59.5 (15.3) |
53.4 (11.9) |
40.8 (4.9) |
32.4 (0.2) |
23.2 (−4.9) |
39.0 (3.9) |
| Mean monthly sunshine hours | 93.9 | 108.5 | 155.4 | 182.8 | 217.4 | 242.2 | 254.9 | 228.4 | 196.7 | 167.3 | 99.4 | 74.4 | 2,021.3 |
| Percent possible sunshine | 31 | 36 | 42 | 46 | 49 | 54 | 56 | 54 | 53 | 48 | 33 | 26 | 45 |
| Average ultraviolet index | 2 | 2 | 2 | 4 | 6 | 6 | 6 | 5 | 4 | 3 | 2 | 1 | 4 |
| Source 1: NOAA (relative humidity, dew point and sun 1961–1990)[7][8][9][10] | |||||||||||||
| Source 2: Weather Atlas (UV)[11] | |||||||||||||

Until January 1, 2000, Allegheny County's government was defined under Pennsylvania's Second Class County Code. The county government was charged with all local activities, including elections, prisons, airports, public health, and city planning. All public offices were headed by elected citizens. There were three elected county commissioners.
On January 1, 2000, the Home-Rule Charter went into effect. It replaced the three elected commissioners with an elected chief officer (the County Executive), a county council with 15 members (13 elected by district, two elected county-wide), and an appointed county manager. The changes were intended to maintain a separation of powers between the executive and legislative branches while providing greater citizen control.
The county has 130 self-governing municipalities, the most in the state.[12] (Luzerne is second with 76).[13] The county has one Second Class City (Pittsburgh) and three Third Class Cities (Clairton, Duquesne, and McKeesport).
A 2004 study found the county would be better served by consolidating the southeastern portion of the county (which includes many small communities with modest economies) into a large municipality ("Rivers City") with a combined population of approximately 250,000.[14]
Allegheny County has a Home Rule Charter form of government since 2000.[15] The county has three branches: the executive, the legislative, and the judicial.[16] The executive branch consists of the County Executive, who is elected for a four-year term and serves as the chief executive officer of the county; and the County Manager, who is appointed by the County Executive and oversees the daily operations of the county departments.[16][17] The current County Executive is Sara Innamorato, a Democrat who took office in 2024.[18] The current County Manager is William D. McKain, who was appointed by Fitzgerald in 2012 and reappointed in 2016 and 2020.[17] The legislative branch consists of the County Council, which is composed of 15 members elected for four-year terms from single-member districts. The council functions as the primary legislative and policy-making body of the county.[16][17] The current County Council President is Patrick Catena, a Democrat who represents District 4 and was elected by his fellow council members in 2018 and 2020.[17] The judicial branch consists of the Court of Common Pleas, which is the general trial court of the county; and the Magisterial District Courts, which are lower courts that handle minor criminal and civil cases. The judges of these courts are elected for ten-year terms.[16]The current President Judge of the Court of Common Pleas is Kimberly Berkeley Clark, who was elected by her fellow judges in 2018 for a five-year term.[16]
Allegheny County has 130 self-governing municipalities, the most in the state. These include one city (Pittsburgh), 96 boroughs, 30 townships, and two home rule municipalities (Bethel Park and McCandless). [19][20] Each municipality has its own elected officials, such as mayor, council, commissioners, supervisors, etc., and its own local services, such as police, fire, public works, etc. [19] Some municipalities also have their own municipal authorities that provide services such as water, sewer, transit, etc.[21]
There have been several proposals to consolidate or merge some of the municipalities in Allegheny County, either with each other or with the City of Pittsburgh, to reduce costs, improve efficiency, and enhance regional cooperation. However, none of these proposals have been implemented so far. [22][23] One of the most recent proposals is from Wilkinsburg, a borough that borders Pittsburgh and faces financial challenges due to declining population and tax base. In 2020, Wilkinsburg residents voted to approve a referendum to explore a merger with Pittsburgh. In 2021, a joint task force was formed to study the feasibility and impact of such a merger. The task force is expected to issue a report by June 2022. If both Wilkinsburg and Pittsburgh councils approve the merger, it would then need approval from the state legislature and governor before taking effect.[22] Another recent proposal is from Allegheny County Economic Development (ACED), which is seeking to enter into an agreement with a consultant to carry out historic preservation compliance activities for projects funded by various federal programs. The consultant would help ACED develop a Programmatic Memorandum of Agreement (PMOA) with the Pennsylvania State Historic Preservation Office (SHPO) and other stakeholders to streamline the review process for projects that may affect historic properties within the county. ACED issued a Request for Proposals (RFP) for this service in January 2022 and expects to select a consultant by March 2022.[24]

| Year | Republican | Democratic | Third party | |||
|---|---|---|---|---|---|---|
| No. | % | No. | % | No. | % | |
| 2020 | 282,913 | 39.03% | 430,759 | 59.43% | 11,128 | 1.54% |
| 2016 | 259,480 | 39.48% | 367,617 | 55.94% | 30,092 | 4.58% |
| 2012 | 262,039 | 42.01% | 352,687 | 56.54% | 9,101 | 1.46% |
| 2008 | 272,347 | 41.64% | 373,153 | 57.05% | 8,539 | 1.31% |
| 2004 | 271,925 | 42.13% | 368,912 | 57.15% | 4,632 | 0.72% |
| 2000 | 235,361 | 40.41% | 329,963 | 56.65% | 17,154 | 2.95% |
| 1996 | 204,067 | 37.89% | 284,480 | 52.82% | 50,068 | 9.30% |
| 1992 | 183,035 | 29.80% | 324,004 | 52.75% | 107,148 | 17.45% |
| 1988 | 231,137 | 39.43% | 348,814 | 59.51% | 6,200 | 1.06% |
| 1984 | 284,692 | 42.76% | 372,576 | 55.96% | 8,480 | 1.27% |
| 1980 | 271,850 | 43.75% | 297,464 | 47.87% | 52,104 | 8.38% |
| 1976 | 303,127 | 46.79% | 328,343 | 50.68% | 16,387 | 2.53% |
| 1972 | 371,737 | 55.60% | 282,496 | 42.26% | 14,302 | 2.14% |
| 1968 | 264,790 | 37.09% | 364,906 | 51.12% | 84,121 | 11.78% |
| 1964 | 241,707 | 33.58% | 475,207 | 66.03% | 2,811 | 0.39% |
| 1960 | 320,970 | 42.76% | 428,455 | 57.07% | 1,293 | 0.17% |
| 1956 | 384,939 | 54.83% | 315,989 | 45.01% | 1,102 | 0.16% |
| 1952 | 359,224 | 49.00% | 370,945 | 50.60% | 2,903 | 0.40% |
| 1948 | 253,272 | 42.60% | 326,303 | 54.89% | 14,931 | 2.51% |
| 1944 | 261,218 | 42.52% | 350,690 | 57.09% | 2,393 | 0.39% |
| 1940 | 263,285 | 41.51% | 367,926 | 58.01% | 2,987 | 0.47% |
| 1936 | 176,224 | 31.35% | 366,593 | 65.21% | 19,377 | 3.45% |
| 1932 | 152,326 | 42.43% | 189,839 | 52.88% | 16,838 | 4.69% |
| 1928 | 215,626 | 56.86% | 160,733 | 42.39% | 2,850 | 0.75% |
| 1924 | 149,296 | 59.01% | 21,984 | 8.69% | 81,733 | 32.30% |
| 1920 | 138,908 | 69.21% | 40,278 | 20.07% | 21,530 | 10.73% |
| 1916 | 77,483 | 55.24% | 52,833 | 37.67% | 9,948 | 7.09% |
| 1912 | 23,822 | 18.85% | 31,417 | 24.86% | 71,147 | 56.29% |
| 1908 | 74,080 | 60.77% | 35,655 | 29.25% | 12,170 | 9.98% |
| 1904 | 90,594 | 76.51% | 21,541 | 18.19% | 6,270 | 5.30% |
| 1900 | 71,780 | 69.94% | 27,311 | 26.61% | 3,533 | 3.44% |
| 1896 | 76,691 | 70.90% | 29,809 | 27.56% | 1,674 | 1.55% |
| 1892 | 45,788 | 58.33% | 30,867 | 39.32% | 1,849 | 2.36% |
| 1888 | 45,118 | 63.58% | 24,710 | 34.82% | 1,138 | 1.60% |
| 1884 | 37,865 | 61.96% | 19,469 | 31.86% | 3,774 | 6.18% |
| 1880 | 35,539 | 59.85% | 22,096 | 37.21% | 1,747 | 2.94% |
As of 4 March 2024,[update] there were 902,957 registered voters in the county; a majority were Democrats. There were 508,935 registered Democrats, 257,857 registered Republicans, 97,708 registered as independents and 38,457 registered with other parties.[27]
Chart of voter registration
| Voter registration and party enrollment | |||||
|---|---|---|---|---|---|
| Party | Number of voters | Percentage | |||
| Democratic | 508,935 | 56.36% | |||
| Republican | 257,857 | 28.56% | |||
| Independent | 97,708 | 10.82% | |||
| Other parties | 38,457 | 4.26% | |||
| Total | 902,957 | 100% | |||
The Republican Party had been historically dominant in county-level politics in the 19th and early 20th centuries; prior to the Great Depression, Pittsburgh and Allegheny County had been majority Republican. Since the Great Depression on the state and national levels, the Democratic Party has been dominant in county-level politics. It is by far the most Democratic county in western Pennsylvania. For much of the time between the Great Depression and the turn of the millennium, it was the second-strongest Democratic bastion in Pennsylvania, behind only Philadelphia.
In 2000, Democrat Al Gore won 56% of the vote and Republican George W. Bush won 41%. In 2004, Democrat John Kerry received 57% of the vote and Republican Bush received 41%. In 2006, Democrats Governor Ed Rendell and Senator Bob Casey Jr. won 59% and 65% of the vote in Allegheny County, respectively. In 2008, Democrat Barack Obama received 57% of the vote, Republican John McCain received 41%, and each of the three state row office winners (Rob McCord for Treasurer, Jack Wagner for Auditor General, and Tom Corbett for Attorney General) also carried Allegheny. In 2016, despite Donald Trump being the first Republican to carry Pennsylvania since 1988, Hillary Clinton did slightly better than Barack Obama's 2012 vote total while Donald Trump was the worst performing Republican in 20 years. In the 2018 Midterms, Democrats received an even higher percentage of the vote with Tom Wolf and Casey receiving approximately two thirds of the county's vote.[28][29] This is an improvement over the approximately 55% each person received in the county in their last election in 2014 and 2012 respectively. In 2020, Joe Biden improved upon Clinton's performance, receiving the highest vote percentage for a Democrat since Michael Dukakis in 1988 and the most votes for a Democrat since Lyndon B. Johnson in 1964.
Source[30]
In 2010 statistics, the largest religious group in Allegheny County was the Roman Catholic Diocese of Pittsburgh, with 460,672 Catholics worshipping at 179 parishes; followed by the United Methodist Church, with 44,204 Methodists in 100 congregations; the Presbyterian Church in the United States of America, with 42,838 Presbyterians in 145 congregations; non-denominational Protestants, with 33,103 adherents in 85 congregations; the Evangelical Lutheran Church in America, with 24,718 Lutherans in 77 congregations; the American Baptist Churches USA, with 17,148 Baptists in 42 congregations; the Assemblies of God, with 12,398 Pentecostals in 30 congregations; Reform Judaism, with 8,483 Jews in 6 congregations; the 7,780 Episcopal Church (United States), with 7,780 Episcopalians in 19 congregations; and Hinduism in the United States, with 6,700 Hindus in four temples. Altogether, 60.6% of the population was claimed as members by religious congregations, although members of historically African-American denominations were underrepresented due to incomplete information.[31] In 2014, Allegheny County had 794 religious organizations, the 11th most out of all US counties.[32]
| Census | Pop. | Note | %± |
|---|---|---|---|
| 1790 | 10,203 | — | |
| 1800 | 15,087 | 47.9% | |
| 1810 | 25,317 | 67.8% | |
| 1820 | 34,921 | 37.9% | |
| 1830 | 50,552 | 44.8% | |
| 1840 | 81,235 | 60.7% | |
| 1850 | 138,290 | 70.2% | |
| 1860 | 178,831 | 29.3% | |
| 1870 | 262,204 | 46.6% | |
| 1880 | 355,869 | 35.7% | |
| 1890 | 551,959 | 55.1% | |
| 1900 | 775,058 | 40.4% | |
| 1910 | 1,018,463 | 31.4% | |
| 1920 | 1,185,808 | 16.4% | |
| 1930 | 1,374,410 | 15.9% | |
| 1940 | 1,411,539 | 2.7% | |
| 1950 | 1,515,237 | 7.3% | |
| 1960 | 1,628,587 | 7.5% | |
| 1970 | 1,605,016 | −1.4% | |
| 1980 | 1,450,085 | −9.7% | |
| 1990 | 1,336,449 | −7.8% | |
| 2000 | 1,281,666 | −4.1% | |
| 2010 | 1,223,348 | −4.6% | |
| 2020 | 1,250,578 | 2.2% | |
| 2023 (est.) | 1,224,825 | −2.1% | |
| U.S. Decennial Census[33] 1790–1960[34] 1900–1990[35] 1990–2000[36] 2010–2018[37] | |||
As of the 2010 census, there were 1,223,348 people living in the county. The population density was 1,676 people per square mile (647 people/km2). The racial makeup of the county was 82.87% White, 14.39% Black or African American, 2.94% Asian, 0.03% Pacific Islander, 0.37% from other races, and 1.40% from two or more races. About 1.31% of the population were Hispanic or Latino of any race.
At the 2000 census,[39] there were 1,281,666 people, 537,150 households, and 332,495 families living in the county. The population density was 1,755 people per square mile (678 people/km2). There were 583,646 housing units at an average density of 799 per square mile (308/km2). The racial makeup of the county was 84.33% White, 12.41% Black or African American, 0.12% Native American, 1.69% Asian, 0.03% Pacific Islander, 0.34% from other races, and 1.07% from two or more races. About 0.87% of the population were Hispanic or Latino of any race. 20.0% were of German, 15.0% Italian, 12.7% Irish, 7.5% Polish and 5.1% English ancestry. 93.5% spoke English and 1.3% Spanish as their first language.
There were 537,150 households, out of which 26.40% had children under the age of 18 living with them, 46.10% were married couples living together, 12.40% had a female householder with no husband present, and 38.10% were non-families. Some 32.70% of all households were made up of individuals, and 13.20% had someone living alone who was 65 years of age or older. The average household size was 2.31 and the average family size was 2.96.
The age distribution of the population shows 21.90% under the age of 18, 8.50% from 18 to 24, 28.30% from 25 to 44, 23.40% from 45 to 64, and 17.80% who were 65 years of age or older. The median age was 40. For every 100 females, there were 90.00 males; for every 100 females age 18 and over, there were 86.20 males.
| Race | Num. | Perc. |
|---|---|---|
| White (NH) | 938,252 | 75.0% |
| Black or African American (NH) | 161,554 | 12.9% |
| Native American (NH) | 1,305 | 0.1% |
| Asian (NH) | 58,318 | 4.66% |
| Pacific Islander (NH) | 304 | 0.02% |
| Other/Mixed (NH) | 56,520 | 4.52% |
| Hispanic or Latino | 34,325 | 2.74% |
|
See also: Economy of Pittsburgh |
In the late 18th century, farming played a critical role in the growth of the area. There was a surplus of grain due to transportation difficulties in linking with the eastern portion of the state. As a result, the farmers distilled the grain into whiskey, which significantly helped the farmers financially.
.svg)
The area quickly became a key manufacturing area in the young nation. Coupled with deposits of iron and coal, and the easy access to waterways for barge traffic, the city quickly became one of the most important steel producing areas in the world. Based on 2007 data from the US Army Corps of Engineers, Pittsburgh is the second (after Laredo, Texas) busiest inland port in the nation.
US steel production declined late in the 20th century, and Allegheny County's economy began a shift to other industries. It is presently known for its hospitals, universities, and industrial centers. Despite the decline of heavy industry, Pittsburgh is home to a number of major companies and is ranked in the top ten among US cities hosting headquarters of Fortune 500 corporations, including U.S. Steel Corporation, PNC Financial Services Group, PPG Industries, and H. J. Heinz Company.
The county leads the state in number of defense contractors supplying the U.S. military.[41]

School districts include:[42]
These private schools provide special education for disabled students:
Allegheny County's public transportation provider is Pittsburgh Regional Transit. The Allegheny County Department of Public Works oversees infrastructure, maintenance, and engineering services in the county.
The Three Rivers Heritage Trail provides uninterrupted bicycle and pedestrian connections along the three rivers in the city, and the Great Allegheny Passage trail runs from downtown Pittsburgh to Washington, D.C.
The Allegheny County Airport is the original airport for Pittsburgh and houses a number of flight schools, charter flight operations, and medevac operations. It is owned and operated by The Allegheny County Airport Authority.
Pittsburgh International Airport is the major passenger airport for the county with service to many destinations on several airlines. Like the Allegheny County Airport, it is also owned and operated by The Allegheny County Airport Authority.
For information about major state roads, see list of State Routes in Allegheny County, Pennsylvania and Allegheny County Belt System.
There are two Pennsylvania state parks in Allegheny County. Point State Park is at the confluence of the Allegheny and Monongahela rivers in Downtown Pittsburgh, and Allegheny Islands State Park is in the Allegheny River in Harmar Township and is undeveloped as of August 2010.
Pennsylvania State Game Lands Number 203 is also located in Allegheny County providing hunting and other activities.
Allegheny Land Trust, a regional land conservation group headquartered in Sewickley, has purchased land in Allegheny County for use as public green spaces for scenic and recreational purposes.[43][44] In 2012 it pursued land formerly owned by the Pittsburgh Cut Flower Company in Richland Township.[45] In 2020, it received a grant to convert a former country club into a public green space.[46][47] In December 2020, it donated 20 undeveloped acres across three parcels in Hampton to expand North Park.[48]

Under Pennsylvania law, there are four types of incorporated municipalities: cities, boroughs, townships, and (in a case) a town. The following municipalities are in Allegheny County:
Census-designated places are geographical areas designated by the US Census Bureau for the purposes of compiling demographic data. They are not actual jurisdictions under Pennsylvania law. Other unincorporated communities, such as villages, may be listed here as well.
Many political subdivisions of Allegheny County have come and gone through subdivision or annexation through the years. These include:
The population ranking of the following table is based on the 2010 census of Allegheny County.[54]
† county seat
| Rank | City/Town/etc. | Population (2010 Census) | Municipal type | Incorporated |
|---|---|---|---|---|
| 1 | † Pittsburgh | 305,704 | City | 1794 (borough) 1816 (city) |
| 2 | Penn Hills | 42,329 | Municipality | 1851 (Penn Twp.) 1958 (Penn Hills Twp.) 1976 (municipality) |
| 3 | Mt. Lebanon | 33,137 | Municipality | 1912 (township) 1975 (municipality) |
| 4 | Bethel Park | 32,313 | Municipality | 1949 (borough) 1978 (municipality) |
| 5 | Ross | 31,105 | Municipality | 1809 |
| 6 | Monroeville | 28,386 | Municipality | 1951 |
| 7 | Plum | 27,126 | Borough | 1788 (township) 1956 (borough) |
| 8 | Allison Park | 21,552 | CDP | |
| 9 | West Mifflin | 20,313 | Borough | 1942 |
| 10 | Baldwin | 19,767 | Borough | 1950 |
| 11 | McKeesport | 19,731 | City | 1842 (borough) 1891 (city) |
| 12 | Wilkinsburg | 15,930 | Borough | 1871 (Sterrett Twp.) 1887 (borough) |
| 13 | Whitehall | 13,944 | Borough | 1948 |
| 14 | Franklin Park | 13,470 | Borough | 1823 |
| 15 | South Park | 13,416 | Township | 1931 |
| 16 | Munhall | 11,406 | Borough | |
| 17 | Carnot-Moon | 11,372 | CDP | |
| 18 | Jefferson Hills | 10,619 | Borough | |
| 19 | North Versailles | 10,229 | Township | 1869 |
| 20 | Brentwood | 9,643 | Borough | 1916 |
| 21 | Swissvale | 8,983 | Borough | |
| 22 | Glenshaw | 8,981 | CDP | |
| 23 | Dormont | 8,593 | Borough | 1909 |
| 24 | Bellevue | 8,370 | Borough | 1867 |
| 25 | Castle Shannon | 8,316 | Borough | 1919 |
| 26 | Pleasant Hills | 8,268 | Borough | |
| 27 | Carnegie | 7,972 | Borough | 1894 |
| 28 | White Oak | 7,862 | Borough | |
| 29 | Clairton | 6,796 | City | 1903 (borough) 1922 (city) |
| 30 | West View | 6,771 | Borough | |
| 31 | Forest Hills | 6,518 | Borough | 1919 |
| 32 | Oakmont | 6,303 | Borough | 1889 |
| 33 | McKees Rocks | 6,104 | Borough | 1892 |
| 34 | Crafton | 5,951 | Borough | |
| 35 | Coraopolis | 5,677 | Borough | 1886 |
| 36 | Duquesne | 5,565 | City | 1891 (borough) 1918 (city) |
| 37 | Fox Chapel | 5,388 | Borough | |
| 38 | Turtle Creek | 5,349 | Borough | |
| 39 | Bridgeville | 5,148 | Borough | 1901 |
| 40 | North Braddock | 4,857 | Borough | |
| 41 | Avalon | 4,705 | Borough | 1874 |
| 42 | Tarentum | 4,530 | Borough | 1842 |
| 43 | Glassport | 4,483 | Borough | |
| 44 | Green Tree | 4,432 | Borough | 1885 |
| 45 | Sewickley | 3,827 | Borough | |
| 46 | Port Vue | 3,798 | Borough | |
| 47 | Millvale | 3,744 | Borough | |
| 48 | Pitcairn | 3,689 | Borough | |
| 49 | Etna | 3,451 | Borough | |
| 50 | Sharpsburg | 3,446 | Borough | |
| 51 | Springdale | 3,405 | Borough | |
| 52 | Mount Oliver | 3,403 | Borough | |
| 53 | Ingram | 3,330 | Borough | |
| 54 | Brackenridge | 3,260 | Borough | 1901 |
| 55 | Trafford (mostly in Westmoreland County) | 3,174 | Borough | 1904 |
| 56 | Homestead | 3,165 | Borough | |
| 57 | Edgewood | 3,118 | Borough | 1888 |
| 58 | Churchill | 3,011 | Borough | |
| 59 | Aspinwall | 2,801 | Borough | 1892 |
| 60 | Gibsonia | 2,733 | CDP | |
| 61 | Liberty | 2,551 | Borough | |
| 62 | Imperial | 2,541 | CDP | |
| 63 | Verona | 2,474 | Borough | 1871 |
| 64 | Emsworth | 2,449 | Borough | |
| 65 | Greenock | 2,195 | CDP | |
| 66 | Wilmerding | 2,190 | Borough | |
| 67 | Braddock | 2,159 | Borough | 1867 |
| 68 | McDonald (mostly in Washington County) | 2,149 | Borough | 1889 |
| 69 | East McKeesport | 2,126 | Borough | |
| 70 | Rankin | 2,122 | Borough | |
| 71 | West Homestead | 1,929 | Borough | |
| 72 | Braddock Hills | 1,880 | Borough | 1946 |
| 73 | East Pittsburgh | 1,822 | Borough | |
| 74 | Dravosburg | 1,792 | Borough | |
| 75 | Ben Avon | 1,781 | Borough | 1891 |
| 76 | Bakerstown | 1,761 | CDP | |
| 77 | Cheswick | 1,746 | Borough | |
| 78 | Sturgeon | 1,710 | CDP | |
| 79 | Edgeworth | 1,680 | Borough | |
| 80 | Versailles | 1,515 | Borough | |
| 81 | Elizabeth | 1,493 | Borough | |
| 82 | Oakdale | 1,459 | Borough | |
| 83 | Russellton | 1,440 | CDP | |
| 84 | Blawnox | 1,432 | Borough | 1925 |
| 85 | Bell Acres | 1,388 | Borough | 1960 |
| 86 | Whitaker | 1,271 | Borough | |
| 87 | Heidelberg | 1,244 | Borough | |
| 88 | Leetsdale | 1,218 | Borough | |
| 89 | Bradford Woods | 1,171 | Borough | 1915 |
| 90 | Rennerdale | 1,150 | CDP | |
| 91 | Lincoln | 1,072 | Borough | |
| 92 | Curtisville | 1,064 | CDP | |
| 93 | Enlow | 1,013 | CDP | |
| 94 | Harwick | 899 | CDP | |
| 95 | Sewickley Heights | 810 | Borough | |
| 96 | Chalfant | 800 | Borough | |
| 97 | Bairdford | 698 | CDP | |
| 98 | Pennsbury Village | 661 | Borough | |
| 99 | Sewickley Hills | 639 | Borough | |
| 100 | Wall | 580 | Borough | |
| 101 | Noblestown | 575 | CDP | |
| 102 | Glen Osborne | 547 | Borough | |
| 103 | Boston | 545 | CDP | |
| 104 | West Elizabeth | 518 | Borough | |
| 105 | Thornburg | 455 | Borough | |
| 106 | Clinton | 434 | CDP | |
| 107 | Rosslyn Farms | 427 | Borough | |
| 108 | Ben Avon Heights | 371 | Borough | 1913 |
| 109 | Glenfield | 205 | Borough | |
| 110 | Haysville | 70 | Borough |