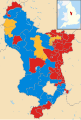
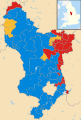
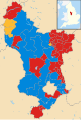
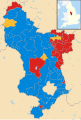
County result maps
-
 2005
2005 -
 2009
2009 -
 2013
2013 -
 2017
2017 -
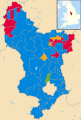 2021
2021
Derbyshire County Council elections are held every four years. Derbyshire County Council is the upper-tier authority for the non-metropolitan county of Derbyshire in England. Since the last boundary changes in 2013, 64 councillors have been elected from 61 electoral divisions.[1]
| Election | Number of councillors elected by each political party | ||||
|---|---|---|---|---|---|
| Conservative | Labour | Liberal Democrats | Independent | Green | |
| 2021 | 45 | 14 | 4 | 0 | 1 |
| 2017 | 37 | 24 | 3 | 0 | 0 |
| 2013 | 18 | 43 | 3 | 0 | 0 |
| 2009 | 33 | 22 | 8 | 1 | 0 |
| 2005 | 14 | 38 | 10 | 0 | 0 |


| Party | Candidate | Votes | % | ±% | |
|---|---|---|---|---|---|
| Labour | Paul Smith | 1,300 | 58.5 | ||
| Conservative | 620 | 27.9 | |||
| Liberal Democrats | 301 | 13.6 | |||
| Majority | 680 | 30.6 | |||
| Turnout | 2,221 | 25.0 | |||
| Labour hold | Swing | ||||
| Party | Candidate | Votes | % | ±% | |
|---|---|---|---|---|---|
| Labour | 966 | 71.7 | +6.5 | ||
| Conservative | 229 | 17.0 | -4.1 | ||
| Liberal Democrats | 153 | 11.4 | -2.3 | ||
| Majority | 737 | 54.7 | |||
| Turnout | 1,348 | 13.4 | |||
| Labour hold | Swing | ||||
| Party | Candidate | Votes | % | ±% | |
|---|---|---|---|---|---|
| Conservative | 1,789 | 49.1 | +2.8 | ||
| Labour | 1,611 | 44.0 | +3.0 | ||
| Liberal Democrats | 251 | 6.9 | -5.9 | ||
| Majority | 187 | 5.1 | |||
| Turnout | 3,651 | 28.7 | |||
| Conservative hold | Swing | ||||
| Party | Candidate | Votes | % | ±% | |
|---|---|---|---|---|---|
| Labour | 943 | 44.1 | -0.1 | ||
| Liberal Democrats | 710 | 33.2 | +12.3 | ||
| Conservative | 487 | 22.8 | -12.0 | ||
| Majority | 233 | 10.9 | |||
| Turnout | 2,140 | 23.0 | |||
| Labour hold | Swing | ||||
| Party | Candidate | Votes | % | ±% | |
|---|---|---|---|---|---|
| Conservative | Carol Hart | 1,443 | 56.8 | +12.3 | |
| Liberal Democrats | Janet Mallet | 571 | 22.5 | +5.7 | |
| Labour | 525 | 20.7 | -18.1 | ||
| Majority | 872 | 34.3 | |||
| Turnout | 2,539 | 30.3 | |||
| Conservative hold | Swing | ||||
| Party | Candidate | Votes | % | ±% | |
|---|---|---|---|---|---|
| Labour | Steve Pickering | 824 | 35.9 | -15.3 | |
| Conservative | Carolyn Renwick | 658 | 28.6 | +11.0 | |
| Independent | James Jesson | 300 | 13.1 | +4.1 | |
| BNP | Lewis Allesbrook | 253 | 11.0 | +11.0 | |
| Independent | David Walpole | 150 | 6.5 | -1.7 | |
| Liberal Democrats | Frank Higgins | 113 | 4.9 | -9.1 | |
| Majority | 166 | 7.3 | |||
| Turnout | 2,298 | 26.6 | |||
| Labour hold | Swing | ||||
| Party | Candidate | Votes | % | ±% | |
|---|---|---|---|---|---|
| Labour | Michelle Booth | 1,261 | 49.9 | -15.9 | |
| Conservative | Kevin Miller | 783 | 31.0 | -3.3 | |
| BNP | Mark Bailey | 327 | 12.9 | +12.9 | |
| Liberal Democrats | Richard Pyle | 158 | 6.2 | +6.2 | |
| Majority | 478 | 18.9 | |||
| Turnout | 2,529 | 29.2 | |||
| Labour hold | Swing | ||||
| Party | Candidate | Votes | % | ±% | |
|---|---|---|---|---|---|
| Conservative | David Taylor (E) | 1118 | 44.9 | +3.1 | |
| UKIP | David Fisher | 715 | 28.7 | +3.6 | |
| Labour | Mike Ratcliffe | 656 | 26.4 | +1.2 | |
| Majority | 403 | 16.2 | |||
| Turnout | 2489 | 25.8 | |||
| Conservative hold | Swing | ||||
| Party | Candidate | Votes | % | ±% | |
|---|---|---|---|---|---|
| Labour | Tricia Gilby (E) | 1293 | 62.0 | -6.7 | |
| UKIP | Paul Christopher Stone | 380 | 18.2 | +18.2 | |
| Independent | Mick Bagshaw | 157 | 7.5 | +7.5 | |
| Liberal Democrats | John Edward Ahern | 135 | 6.5 | -2.8 | |
| Conservative | Lewis Mark Preston | 120 | 5.8 | -5.4 | |
| Majority | |||||
| Turnout | 2085 | 21.9 | |||
| Labour hold | Swing | ||||
| Party | Candidate | Votes | % | ±% | |
|---|---|---|---|---|---|
| Conservative | Stephen Bull (E) | 4715 | 68.6 | +9.5 | |
| Labour | Simon John Meredith | 965 | 14.0 | +1.5 | |
| Green | Andrew White | 647 | 9.4 | +9.4 | |
| Liberal Democrats | David Rowe | 543 | 7.9 | -0.7 | |
| Majority | |||||
| Turnout | 6870 | 73.3 | |||
| Conservative hold | Swing | ||||
| Party | Candidate | Votes | % | ±% | |
|---|---|---|---|---|---|
| Conservative | Jo Wild | 1017 | 51.0 | +8.1 | |
| Labour | Martin Rutter | 466 | 21.5 | -1.7 | |
| Liberal Democrats | Michael Crapper | 314 | 13.6 | +4.6 | |
| UKIP | Mike Dawson | 285 | 13.1 | -11.0 | |
| Majority | 641 | 29.5 | |||
| Turnout | 2172 | ||||
| Conservative hold | Swing | ||||
| Party | Candidate | Votes | % | ±% | |
|---|---|---|---|---|---|
| Labour | Ruth George | 1851 | 50.4 | ||
| Conservative | John Frederick Walton | 1048 | 28.5 | ||
| Liberal Democrats | David William Lomax | 721 | 19.6 | ||
| Independent | Paddy Bann | 52 | 1.4 | ||
| Turnout | 3,672 | ||||
| Labour gain from Conservative | Swing | ||||
| Party | Candidate | Votes | % | ±% | |
|---|---|---|---|---|---|
| Labour | Joel Bryan | 1,104 | 51.1 | ||
| Conservative | Chris Page | 723 | 33.5 | ||
| Liberal Democrats | Rachel Allen | 239 | 11.1 | ||
| Green | Ashley Dunn | 94 | 4.4 | ||
| Turnout | 2,260 | 22.8 | |||
| Labour gain from Conservative | Swing | ||||
| Party | Candidate | Votes | % | ±% | |
|---|---|---|---|---|---|
| Labour | Alan Haynes | 786 | 62.2 | +29.8 | |
| Conservative | Jacqueline Geddes | 477 | 37.8 | -21.4 | |
| Majority | 309 | 24.5 | |||
| Turnout | 1,263 | ||||
| Labour gain from Conservative | Swing | ||||