| |||||||||||||||||||||||||||||||||||||
All 34 seats to Hinckley and Bosworth Borough Council 18 seats needed for a majority | |||||||||||||||||||||||||||||||||||||
---|---|---|---|---|---|---|---|---|---|---|---|---|---|---|---|---|---|---|---|---|---|---|---|---|---|---|---|---|---|---|---|---|---|---|---|---|---|
| |||||||||||||||||||||||||||||||||||||
|
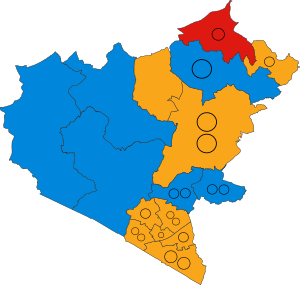
The 2019 Hinckley and Bosworth Borough Council election took place on 2 May 2019 to elect members of Hinckley and Bosworth Borough Council in England.[1] This was on the same day as other local elections. The election resulted in the Liberal Democrats gaining control of the council from the Conservatives.
2019 Hinckley and Bosworth Borough Council election | ||||||||||
---|---|---|---|---|---|---|---|---|---|---|
Party | Candidates | Seats | Gains | Losses | Net gain/loss | Seats % | Votes % | Votes | +/− | |
Liberal Democrats | 34 | 21 | 9 | 0 | 9 | 61.8 | 46.4 | 28,691 | +17.0 | |
Conservative | 34 | 11 | 0 | 10 | 10 | 32.4 | 35.9 | 22,212 | –1.7 | |
Labour | 33 | 2 | 1 | 0 | 1 | 5.9 | 14.3 | 8,834 | –3.7 | |
UKIP | 5 | 0 | 0 | 0 | 0.0 | 1.9 | 1,185 | –9.9 | ||
Independent | 2 | 0 | 0 | 0 | 0.0 | 0.7 | 463 | –2.2 | ||
Green | 1 | 0 | 0 | 0 | 0.0 | 0.7 | 424 | +0.5 |
Party | Candidate | Votes | % | ±% | |
---|---|---|---|---|---|
Conservative | Jonathan Collett | 648 | 59.5 | +6.7 | |
Liberal Democrats | Wendy Moore | 167 | 15.3 | +0.2 | |
UKIP | Irina Ratcliffe | 153 | 14.0 | −4.8 | |
Labour | Rupert Herd | 121 | 11.1 | −2.2 | |
Turnout | 1,107 | 37.53 | |||
Conservative hold | Swing |
Party | Candidate | Votes | % | ±% | |
---|---|---|---|---|---|
Liberal Democrats | Bill Crooks | 887 | 80.3 | +18.9 | |
Conservative | Jenny Simmons | 135 | 12.2 | −7.5 | |
Labour | Cory Cronogue | 83 | 7.5 | −1.5 | |
Turnout | 1,112 | 42.41 | |||
Liberal Democrats hold | Swing |
Party | Candidate | Votes | % | ±% | |
---|---|---|---|---|---|
Conservative | Hazel Smith | 704 | 39.4 | ||
Conservative | Russell Roberts | 647 | 36.2 | ||
Conservative | Huw Williams | 629 | 35.2 | ||
Liberal Democrats | Michael Gould | 611 | 34.2 | ||
Liberal Democrats | Pete Stead-Davis | 600 | 33.5 | ||
Liberal Democrats | Patricia Gould | 590 | 33.0 | ||
Labour | Jim Buck | 401 | 22.4 | ||
Labour | Andre Wheeler | 396 | 22.1 | ||
Labour | Rick Middleton | 345 | 19.3 | ||
Turnout | 1,849 | 27.75 | |||
Conservative hold | Swing | ||||
Conservative hold | Swing |
Party | Candidate | Votes | % | ±% | |
---|---|---|---|---|---|
Liberal Democrats | Danny Findlay | 1,250 | 46.0 | ||
Liberal Democrats | Barry Walker | 1,248 | 45.9 | ||
Liberal Democrats | Paul Williams | 1,226 | 45.1 | ||
Conservative | Amanda Wright | 1,099 | 40.4 | ||
Conservative | Mike Hall | 1,078 | 39.7 | ||
Conservative | David MacDonald | 973 | 35.8 | ||
Labour | Phil Naldrett | 300 | 11.0 | ||
Labour | Debbie Wilbur | 294 | 10.8 | ||
Labour | James Ross | 276 | 10.2 | ||
Turnout | 2,763 | 37.13 | |||
Liberal Democrats gain from Conservative | Swing | ||||
Liberal Democrats gain from Conservative | Swing |
Party | Candidate | Votes | % | ±% | |
---|---|---|---|---|---|
Liberal Democrats | Richard Flemming | 697 | 46.1 | ||
Liberal Democrats | Dawn Glenville | 697 | 46.1 | ||
Conservative | Nigel Nickerson | 585 | 38.7 | ||
Conservative | Roger Johnson | 536 | 35.5 | ||
UKIP | Neale Smith | 198 | 13.1 | ||
Labour | Christina Emmett | 158 | 10.5 | ||
Labour | Marie Mills | 149 | 9.9 | ||
Turnout | 1,606 | 33.78 | |||
Liberal Democrats gain from Conservative | Swing | ||||
Liberal Democrats gain from Conservative | Swing |
Party | Candidate | Votes | % | ±% | |
---|---|---|---|---|---|
Conservative | Maureen Cook | 728 | 65.3 | +9.9 | |
Liberal Democrats | David Taylor | 233 | 20.9 | +3.7 | |
Labour | Rosie Yule | 154 | 13.8 | −0.1 | |
Turnout | 1,142 | 38.79 | |||
Conservative hold | Swing |
Party | Candidate | Votes | % | ±% | |
---|---|---|---|---|---|
Conservative | Chris Ladkin | 890 | 42.9 | ||
Conservative | Claire Allen | 868 | 41.9 | ||
Conservative | Richard Allen | 854 | 41.2 | ||
Liberal Democrats | Vivienne Darker | 730 | 35.2 | ||
Liberal Democrats | Sue Mannion | 722 | 34.8 | ||
Liberal Democrats | Mathew Hulbert | 679 | 32.7 | ||
Labour | Anna Franklin | 359 | 17.3 | ||
Labour | Lorraine Daniels | 335 | 16.2 | ||
Labour | Justine Duplock | 318 | 15.3 | ||
Turnout | 2,141 | 26.81 | |||
Conservative hold | Swing | ||||
Conservative hold | Swing |
Party | Candidate | Votes | % | ±% | |
---|---|---|---|---|---|
Liberal Democrats | Martin Cartwright | 863 | 51.8 | ||
Liberal Democrats | Ted Hollick | 815 | 48.9 | ||
Conservative | Jenny O'Shea | 652 | 39.1 | ||
Conservative | Atul Joban | 505 | 30.3 | ||
Labour | Katharine Griffiths | 209 | 12.5 | ||
Labour | Julia Taylor | 163 | 9.8 | ||
Turnout | 1,715 | 31.72 | |||
Liberal Democrats hold | Swing | ||||
Liberal Democrats hold | Swing |
Party | Candidate | Votes | % | ±% | |
---|---|---|---|---|---|
Liberal Democrats | Stuart Bray | 914 | 59.8 | ||
Liberal Democrats | Linda Mullaney | 856 | 56.0 | ||
Conservative | Natasha Jolob | 352 | 23.0 | ||
Conservative | Peter Wallace | 322 | 21.1 | ||
Labour | Rosie Lythgoe-Cheetham | 269 | 17.6 | ||
Labour | James Medhurst | 229 | 15.0 | ||
Turnout | 1,558 | 30.45 | |||
Liberal Democrats hold | Swing | ||||
Liberal Democrats hold | Swing |
Party | Candidate | Votes | % | ±% | |
---|---|---|---|---|---|
Liberal Democrats | David Bill | 1,351 | 68.0 | ||
Liberal Democrats | Ann Pendlebury | 1,198 | 60.3 | ||
Liberal Democrats | Keith Lynch | 1,161 | 58.4 | ||
Conservative | Dave Beck | 409 | 20.6 | ||
Conservative | Del Young | 352 | 17.7 | ||
Conservative | Malcolm Cook | 284 | 14.3 | ||
Labour | Chris Kealey | 215 | 10.8 | ||
Labour | Lauren Gamble | 168 | 8.5 | ||
Labour | Marian Naldrett | 163 | 8.2 | ||
Independent | Benn Moore | 129 | 6.5 | ||
Turnout | 2,021 | 28.82 | |||
Liberal Democrats hold | Swing | ||||
Liberal Democrats hold | Swing |
Party | Candidate | Votes | % | ±% | |
---|---|---|---|---|---|
Liberal Democrats | Michael Mullaney | 1,802 | 59.5 | ||
Liberal Democrats | Keith Nichols | 1,627 | 53.7 | ||
Liberal Democrats | Scott Gibbens | 1,529 | 50.5 | ||
Conservative | Jan Kirby | 862 | 28.5 | ||
Conservative | Connor Daldry | 752 | 24.8 | ||
Conservative | Khalid Ansari | 638 | 21.1 | ||
UKIP | Brian Reid | 431 | 14.2 | ||
Labour | Tony Wallis | 232 | 7.7 | ||
Labour | Valerie Mitchell | 229 | 7.6 | ||
Labour | Heather White | 187 | 6.2 | ||
Turnout | 3,037 | 37.14 | |||
Liberal Democrats gain from Conservative | Swing | ||||
Liberal Democrats hold | Swing | ||||
Liberal Democrats hold | Swing |
Party | Candidate | Votes | % | ±% | |
---|---|---|---|---|---|
Liberal Democrats | David Cope | 835 | 59.4 | ||
Liberal Democrats | Lynda Hodgkins | 774 | 55.1 | ||
UKIP | Chris Simpson | 256 | 18.2 | ||
Conservative | Andrew Baines | 249 | 17.7 | ||
Conservative | Michelle Nash | 231 | 16.4 | ||
Labour | Jemima Sampson | 128 | 9.1 | ||
Labour | Kathy Leese | 123 | 8.8 | ||
Turnout | 1,412 | 25.63 | |||
Liberal Democrats hold | Swing | ||||
Liberal Democrats hold | Swing |
Party | Candidate | Votes | % | ±% | |
---|---|---|---|---|---|
Labour | Matthew Lay | 1,097 | 60.2 | ||
Labour | Andy Furlong | 720 | 39.5 | ||
Conservative | Peter Bedford | 652 | 35.8 | ||
Conservative | William Surtees | 427 | 23.4 | ||
Independent | David Sprason | 334 | 18.3 | N/A | |
Liberal Democrats | David Mullaney | 93 | 5.1 | ||
Liberal Democrats | Dale Smith | 63 | 3.5 | ||
Turnout | 1,833 | 38.48 | |||
Labour hold | Swing | ||||
Labour gain from Conservative | Swing |
Party | Candidate | Votes | % | ±% | |
---|---|---|---|---|---|
Liberal Democrats | Joyce Crooks | 1,423 | 54.9 | ||
Liberal Democrats | Mark Sheppard-Bools | 1,289 | 49.7 | ||
Liberal Democrats | Robin Webber-Jones | 1,116 | 43.1 | ||
Conservative | Ruth Camamile | 879 | 33.9 | ||
Conservative | Miriam Surtees | 759 | 29.3 | ||
Conservative | Brian Sutton | 706 | 27.2 | ||
Green | Mick Gregg | 424 | 16.4 | N/A | |
Labour | Terry Gallagher | 237 | 9.1 | ||
Labour | Sarah Hall | 187 | 7.2 | ||
Labour | Tony Simhani | 174 | 6.7 | ||
Turnout | 2,636 | 40.12 | |||
Liberal Democrats gain from Conservative | Swing | ||||
Liberal Democrats gain from Conservative | Swing |
Party | Candidate | Votes | % | ±% | |
---|---|---|---|---|---|
Conservative | Ozzy O'Shea | 1,196 | 72.7 | ||
Conservative | Christopher Boothby | 1,002 | 60.9 | ||
Labour | Steven Malcherczyk | 326 | 19.8 | ||
Liberal Democrats | Rosanne Webber-Jones | 280 | 17.0 | ||
Liberal Democrats | Noel Robinson | 169 | 10.3 | ||
Turnout | 1,686 | 32.37 | |||
Conservative hold | Swing | ||||
Conservative hold | Swing |
Party | Candidate | Votes | % | ±% | |
---|---|---|---|---|---|
Conservative | Kevin Morrell | 609 | 58.5 | −0.5 | |
Liberal Democrats | Roger Laine | 196 | 18.8 | +6.9 | |
UKIP | Alan Wood | 147 | 14.1 | +0.1 | |
Labour | Hannah Moreton | 89 | 8.5 | −6.6 | |
Turnout | 1,044 | 40.12 | |||
Conservative hold | Swing |