| ||||||||||||||||||||||||||||||||||||||||||||||||||||||||||||||||||||
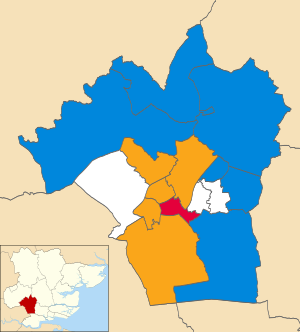
12 of the 37 seats to Brentwood Borough Council 19 seats needed for a majority | ||||||||||||||||||||||||||||||||||||||||||||||||||||||||||||||||||||
---|---|---|---|---|---|---|---|---|---|---|---|---|---|---|---|---|---|---|---|---|---|---|---|---|---|---|---|---|---|---|---|---|---|---|---|---|---|---|---|---|---|---|---|---|---|---|---|---|---|---|---|---|---|---|---|---|---|---|---|---|---|---|---|---|---|---|---|---|
| ||||||||||||||||||||||||||||||||||||||||||||||||||||||||||||||||||||
Winner of each seat at the 2019 Brentwood Borough Council election | ||||||||||||||||||||||||||||||||||||||||||||||||||||||||||||||||||||
|
The 2019 Brentwood Borough Council election took place on 2 May 2019 to elect members of Brentwood Borough Council in England. This was on the same day as other local elections.[1]
2019 Brentwood Borough Council election | ||||||||||
---|---|---|---|---|---|---|---|---|---|---|
Party | This election | Full council | This election | |||||||
Seats | Net | Seats % | Other | Total | Total % | Votes | Votes % | +/− | ||
Conservative | 6 | 5 | 50.0 | 14 | 20 | 54.1 | 6,836 | 41.6 | -4.0 | |
Liberal Democrats | 5 | 4 | 41.7 | 8 | 13 | 35.1 | 6,733 | 40.9 | +6.4 | |
Labour | 1 | 1 | 8.3 | 2 | 3 | 8.1 | 1,719 | 10.5 | -3.5 | |
Independent | 0 | 0.0 | 1 | 1 | 2.7 | 464 | 2.8 | -2.1 | ||
Green | 0 | 0.0 | 0 | 0 | 0.0 | 542 | 3.3 | +2.2 | ||
UKIP | 0 | 0.0 | 0 | 0 | 0.0 | 155 | 0.9 | New |
Party | Candidate | Votes | % | ±% | |
---|---|---|---|---|---|
Liberal Democrats | Mark Lewis | 879 | 57.0 | +5.1 | |
Conservative | Mellissa Slade | 362 | 23.5 | −4.8 | |
Labour | Tony Blunsten | 155 | 10.1 | −4.1 | |
Green | John Hamilton | 145 | 9.4 | +3.8 | |
Majority | 517 | 33.5 | |||
Turnout | 1,541 | 29.0 | |||
Liberal Democrats gain from Conservative | Swing |
Party | Candidate | Votes | % | ±% | |
---|---|---|---|---|---|
Labour | Tim Barrett | 534 | 40.5 | −1.7 | |
Conservative | Andrew Wiles | 477 | 36.2 | −4.4 | |
Liberal Democrats | Brenner Munden | 306 | 23.2 | +6.0 | |
Majority | 57 | 4.3 | |||
Turnout | 1,317 | 29.0 | |||
Labour gain from Conservative | Swing |
Party | Candidate | Votes | % | ±% | |
---|---|---|---|---|---|
Liberal Democrats | Sarah Cloke | 824 | 48.2 | −3.3 | |
Conservative | William Russell | 650 | 38.0 | +4.0 | |
Labour | Deborah Foster | 123 | 7.2 | −7.3 | |
Green | Karen Smith | 114 | 6.7 | New | |
Majority | 174 | 10.2 | |||
Turnout | 1,711 | 31.0 | |||
Liberal Democrats gain from Conservative | Swing |
Party | Candidate | Votes | % | ±% | |
---|---|---|---|---|---|
Conservative | Cliff Poppy | 805 | 55.7 | −6.9 | |
Liberal Democrats | Hugh Gorton | 557 | 38.5 | +11.2 | |
Labour | David Jobbins | 84 | 5.8 | −4.3 | |
Majority | 248 | 17.2 | |||
Turnout | 1,446 | 31.0 | |||
Conservative hold | Swing |
Party | Candidate | Votes | % | ±% | |
---|---|---|---|---|---|
Conservative | Maria Pearson | 635 | 70.6 | +14.1 | |
Liberal Democrats | Anne Long | 188 | 20.9 | +17.9 | |
Labour | Richard Millwood | 77 | 8.6 | +2.1 | |
Majority | 447 | 49.7 | |||
Turnout | 900 | 31.0 | |||
Conservative hold | Swing |
No Independent candidate as previous (-34.0).
Party | Candidate | Votes | % | ±% | |
---|---|---|---|---|---|
Conservative | Chris Hossack | 424 | 55.4 | −1.8 | |
Labour | Francisca Dapp | 180 | 23.5 | +5.1 | |
Liberal Democrats | David Green | 161 | 21.0 | +6.3 | |
Majority | 244 | 31.9 | |||
Turnout | 765 | 26.0 | |||
Conservative hold | Swing |
No Independent candidate as previous (-9.6).
Party | Candidate | Votes | % | ±% | |
---|---|---|---|---|---|
Conservative | Sandy Tanner | 587 | 61.6 | −11.6 | |
Liberal Democrats | Gary Macdonnell | 225 | 23.6 | +13.3 | |
Labour | Liam Preston | 141 | 14.8 | −0.6 | |
Majority | 362 | 38.0 | |||
Turnout | 953 | 31 | |||
Conservative hold | Swing |
Party | Candidate | Votes | % | ±% | |
---|---|---|---|---|---|
Conservative | Noelle Hones | 825 | 45.3 | −2.5 | |
Liberal Democrats | Darryl Sankey | 752 | 41.3 | +2.9 | |
Green | Paul Jeater | 162 | 8.9 | +3.3 | |
Labour | Paul Murphy | 84 | 4.6 | −5.8 | |
Majority | 73 | 4.0 | |||
Turnout | 1,823 | 37.0 | |||
Conservative hold | Swing |
Party | Candidate | Votes | % | ±% | |
---|---|---|---|---|---|
Liberal Democrats | Vicky Davies | 1,063 | 71.5 | −1.7 | |
Conservative | Kelly Herbert | 313 | 21.0 | +2.7 | |
Labour | Patricia Smith | 111 | 7.5 | −1.0 | |
Majority | 750 | 50.5 | |||
Turnout | 1,487 | 32.0 | |||
Liberal Democrats hold | Swing |
Party | Candidate | Votes | % | ±% | |
---|---|---|---|---|---|
Liberal Democrats | Andrew Fryd | 995 | 53.9 | +15.5 | |
Conservative | Louise Rowlands | 780 | 42.3 | −12.8 | |
Labour | June Simmons | 70 | 3.8 | −2.7 | |
Majority | 215 | 11.6 | |||
Turnout | 1,845 | 44.0 | |||
Liberal Democrats gain from Conservative | Swing |
Party | Candidate | Votes | % | ±% | |
---|---|---|---|---|---|
Conservative | Peter Jakobsson | 566 | 52.2 | ||
Independent | Tracey Thomas | 464 | 42.8 | ||
Labour | Marian Jenkins | 54 | 5.0 | ||
Majority | 102 | 9.4 | |||
Turnout | 1,084 | 35.0 | |||
Conservative hold | Swing |
Party | Candidate | Votes | % | ±% | |
---|---|---|---|---|---|
Liberal Democrats | Jason Laplain | 783 | 49.7 | +14.3 | |
Conservative | Stephen Green | 412 | 26.1 | −2.3 | |
UKIP | Kris Hicks | 155 | 9.8 | New | |
Green | Janice Gearon-Simm | 121 | 7.7 | New | |
Labour | Susan Kortlandt | 106 | 6.7 | −6.4 | |
Majority | 371 | 23.6 | |||
Turnout | 1,577 | 32.0 | |||
Liberal Democrats gain from Conservative | Swing |